
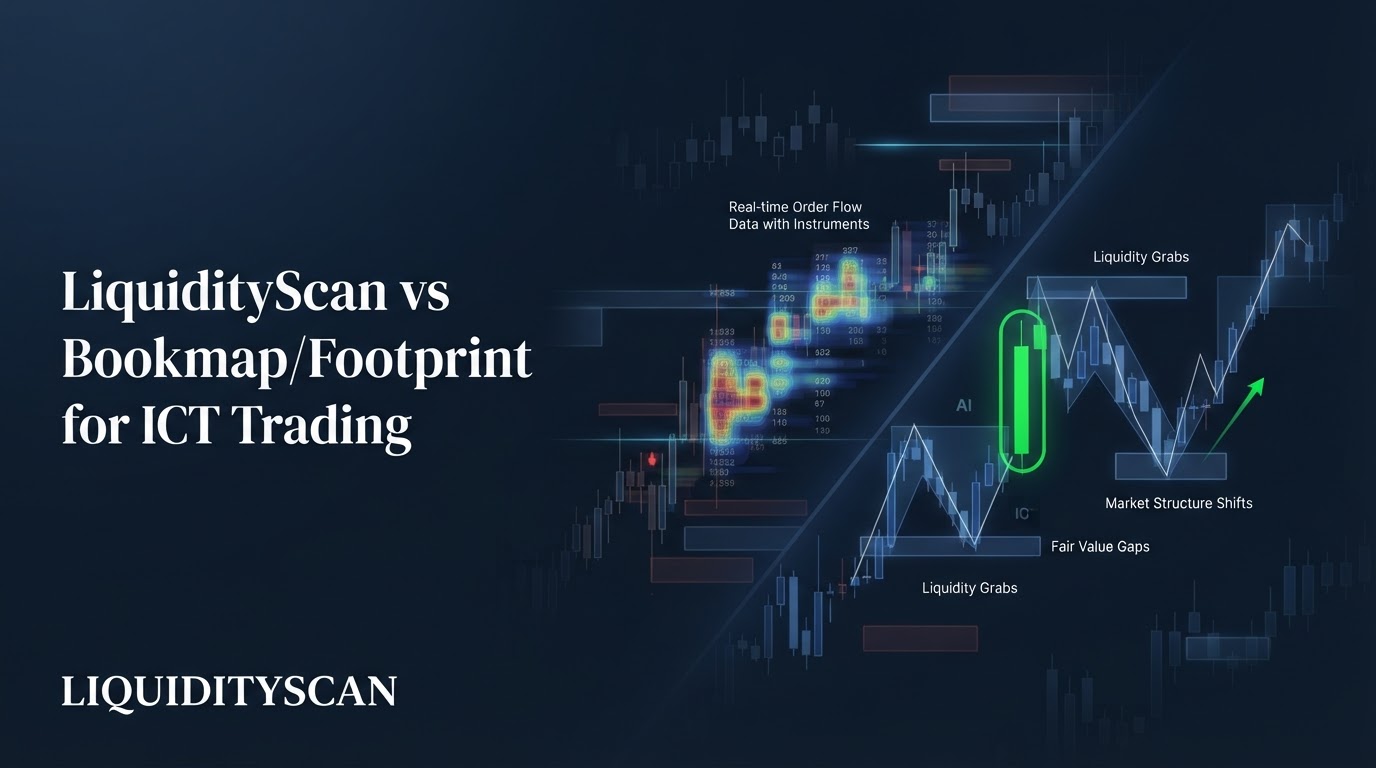
Bookmap vs Footprint Charts for ICT: What Each Tool Actually Does
When traders weigh Bookmap vs footprint charts for ICT, the honest answer: neither replaces the other, or a pattern scanner. Bookmap draws a live order-book heatmap; footprint charts show bid/ask volume per price; LiquidityScan detects ICT structure across many symbols. Three jobs, three altitudes.
The confusion comes from lumping them together as "order flow." In practice, they sit at different points in the same workflow: one class reads how price is behaving right now on a single instrument, the other finds where a valid setup exists across the whole market. Getting the distinction right saves you money and screen time.
What Bookmap and Footprint Charts Show
Both Bookmap and footprint charts are order-flow tools, and both are excellent at the job they were built for: reading the micro-behavior of a single instrument in real time. They differ in what slice of order flow they visualize.
Bookmap: the live order-book heatmap
Bookmap renders the resting limit orders in the book as a heatmap — brighter bands where more size is stacked — plus dots for executed volume as trades print. You watch large resting bids and offers appear, get pulled, or get absorbed in real time.
It is a window into resting liquidity and the tape on one symbol, and for DOM-based scalpers on liquid futures it is genuinely powerful.
Footprint charts: bid/ask volume per price
A footprint chart breaks each candle into the volume that traded on the bid versus the ask at every price level inside that bar. That exposes where buyers or sellers were actually aggressive, where volume clustered, and where absorption happened — heavy selling into a level that refuses to break.
It is a forensic view of executed volume that a standard candle simply cannot show.
Concretely: say EURUSD trades into a demand level at 1.0820. On a footprint you might see 3,000 contracts hit the bid while price barely ticks down two pips — sellers hitting a wall of resting bids that absorb them. The delta stays negative but price won't fall.
That stall is a leading tell the level is defended, visible bar by bar before any candle closes red or green.
The shared strength: micro-level truth about one instrument. If you want to know whether the offer at a level is being absorbed or is about to fold, order-flow tools answer that directly. No candle scanner can.
What LiquidityScan Does, and Why It's a Different Altitude
LiquidityScan is not an order-flow tool at all. It is a real-time ICT/SMC pattern scanner that reads confirmed, closed candles across hundreds of crypto and TradFi instruments and flags where specific ICT structures have formed.
It detects Order Blocks (OB+/OB++ strong order blocks confirmed by a liquidity grab), Fair Value Gaps graded by multi-timeframe nesting, market structure events like BOS and CHoCH, and Liquidity Sweeps that reverse — then surfaces them as browsable signals with multi-timeframe confluence and push alerts.
The altitude is the key word. Bookmap and footprint charts zoom in on one instrument's live tape. LiquidityScan zooms out across the market to answer a different question: where, right now, is there a valid ICT setup worth my attention?
Because detection runs on closed candles only, its signals do not repaint after the candle closes — the trade-off being that it deliberately does not see intrabar execution the way order-flow tools do.
Consider the volume of work involved. An order-flow trader can meaningfully watch one, maybe two books at once. An ICT trader who cares about 40 pairs across crypto and TradFi cannot manually inspect all of them for a fresh order block on every 4H close.
The scanner does that pass automatically and hands back only the pairs that qualify, ranked and drawn, with the setup's geometry rendered on a mini-chart. That is coverage a human eye can't match — and coverage is precisely the dimension order-flow tools don't compete on.
It is an analysis and detection tool, not a signal service. Most engines surface a zone or a structural event, not an entry, stop, and target. The job is to find and objectively mark the setup, not to tell you to buy. The discretion, and the execution, stay entirely with you.
Bookmap vs Footprint Charts vs LiquidityScan: The Comparison
The clearest way to see the split is dimension by dimension. Order-flow tools and a pattern scanner rarely overlap — where one is strong, the other usually isn't even trying to compete.
| Dimension | Bookmap / Footprint Charts | LiquidityScan |
|---|---|---|
| Core job | Read live executed order flow / resting liquidity on one instrument | Detect ICT/SMC price patterns across many instruments |
| Data primitive | Order book depth + tape (Bookmap); bid/ask volume per price (footprint) | Closed OHLC candles across timeframes |
| Coverage | One chart / instrument at a time | Hundreds of crypto + TradFi symbols in parallel |
| Timing | Real-time, intrabar, tick-level | On candle close (no repaint) |
| ICT structure detection | Manual — you read absorption and infer the level yourself | Automated OB+, FVG+/++, BOS/CHoCH, sweep detection |
| Multi-symbol scanning | No | Yes, market-wide |
| Alerts | Price/level alerts on the loaded instrument | Web/native push on detected ICT setups across the market |
| Learning curve | Steep (DOM/tape reading is a skill) | Low — setups are labeled and drawn |
| Best for | Micro execution, absorption, DOM scalping | Finding where the ICT setup is, at scale |
Read across any row and the pattern holds: these tools are complementary, not substitutes. That is the whole point of the Bookmap vs footprint charts for ICT question — you are usually not choosing between them and a scanner, you are deciding which layer of the job each one owns.
Where Order-Flow Tools Win, and Where They're Limited for ICT at Scale
Order-flow tools deserve credit for what they do well, and it is a lot. Be fair to them before reaching for the trade-offs.
Where Bookmap and footprint charts genuinely win:
- Real order-book depth and tape reading — you see resting size and executed prints a candle cannot represent. At a point of interest, that is decisive information.
- Absorption and exhaustion — a footprint delta stalling into a level, or a Bookmap iceberg soaking up market sells, tells you the level is holding before price even confirms.
- Micro execution — for shaving ticks on entry or reading a DOM scalp on a liquid future, nothing beats live order flow.
Where they're limited for ICT specifically, at scale:
- Single-instrument focus — you watch one book at a time. You cannot ask "which of my 40 pairs just formed a strong order block?" — that is not what the tool does.
- Steep learning curve and cost — reading the tape well takes months, and full order-flow suites plus data feeds are expensive relative to a chart subscription.
- No cross-symbol ICT scanning — there is no built-in detection that scans the market for OB, FVG, structure, or sweeps and ranks them.
- No automated ICT pattern detection — the tool shows raw order flow; translating it into an ICT Order Block or Draw on Liquidity is entirely on you.
None of that is a knock on the tools — it is simply not their job. Bookmap vs footprint charts for ICT is a debate about micro execution; cross-market ICT detection is a separate problem those tools were never built to solve.
That gap is exactly what a scanner fills. LiquidityScan adds market-wide ICT scanning, objective OB+/FVG/structure detection, multi-timeframe confluence, and alerts — the ICT-specific coverage order-flow tools do not provide. It does not, in return, read the tape. Different jobs.
There is also a consistency angle worth naming. Two traders reading the same footprint can disagree on whether a level was truly absorbed — tape reading is a judgment skill, and judgment drifts with fatigue and bias.
Rule-based detection removes that variance from the finding step: an OB+ either meets its criteria (a base candle whose impulse took prior swing liquidity) or it doesn't. You still apply discretion at the entry, where order flow shines — but you start from an objective, repeatable list rather than a hunt across charts.
That division of labor, objective search plus discretionary confirmation, is why the two tool classes reinforce each other instead of competing.
A Realistic Combined Workflow (and Who Picks Which)
The pros who use both do not treat it as a choice. They chain the tools by altitude: scanner to find, order flow to confirm.
- Scan surfaces the setup. LiquidityScan flags a fresh, unmitigated OB+ on BTCUSDT 4H — an order block confirmed by an impulse that took prior swing liquidity — and a push alert fires as price approaches the zone.
- You drop to order flow at the zone. You load that BTC level in Bookmap or a footprint chart and watch how price behaves inside it: is the offer being absorbed? Is delta flipping? Is resting size defending the level?
- Order flow confirms or vetoes. Heavy absorption and a delta shift as price taps the OB+ is your confirmation to act. A limp, low-volume tap with no absorption is your reason to pass.
The scanner answers where the ICT setup is across the market; the order-flow tool answers how price is behaving at that level right now. That is the same complementary logic covered in the live ICT-versus-footprint discussions — the scanner does the wide search, order flow does the close read.
Who should pick which:
- Pick order-flow tools if you trade one or two liquid instruments, scalp execution, and live inside the DOM. Bookmap or footprint charts are your primary lens.
- Pick a scanner if you trade ICT across many pairs, can't watch every chart, and want objective OB/FVG/structure detection with alerts so setups come to you.
- Pick both if you want the wide net and the sniper read — scan to find, order flow to confirm at the zone. This is the setup most serious ICT desks converge on once they stop treating the tools as rivals.
So the real takeaway on Bookmap vs footprint charts for ICT is that it is rarely a versus at all. Bookmap and footprint charts are excellent order-flow instruments; LiquidityScan is a cross-market ICT detection layer. Use them for the jobs they were built for, and the pairing is stronger than either alone.
Frequently Asked Questions
Is Bookmap better than footprint charts for ICT trading?
Neither is universally better — they show different slices of order flow. Bookmap visualizes resting order-book liquidity and the live tape; footprint charts show bid/ask volume traded at each price. For reading absorption at an ICT point of interest, both work; many traders run one of them alongside a candle chart rather than choosing.
Can a scanner replace order-flow tools?
No, and it isn't trying to. A scanner like LiquidityScan detects ICT patterns across many symbols on closed candles, but it cannot read intrabar tape, resting depth, or absorption. Order-flow tools do that. The scanner finds where the setup is; order flow reads how price behaves there. They cover different jobs.
Do I need order flow to trade ICT?
No. Plenty of ICT traders work entirely from price structure — order blocks, fair value gaps, liquidity sweeps, and market structure on candles. Order-flow tools add a confirmation layer at the entry level, which some traders value highly and others skip. They are an enhancement, not a requirement, for an ICT approach.
Why not just watch every chart manually instead of a scanner?
You can, but it doesn't scale. Watching resting liquidity in Bookmap is one instrument at a time, and eyeballing dozens of charts for order blocks and FVGs is slow and inconsistent. A scanner detects those structures market-wide on every closed candle and alerts you, so you spend your attention reading the few setups that already qualify.
Related query paths
Follow the natural path from comparing these tools to combining them and automating the search.
- ICT vs Footprint Charts — the foundational comparison of price-structure reading against executed-volume order flow.
- Bookmap with ICT: Confirm POIs — the exact workflow for confirming an ICT point of interest with order flow.
- Validating FVG with Order Flow: A Professional's Guide — how absorption and delta confirm a fair value gap at the level.
- Are Order Blocks Real? An Order-Flow Check — an evidence-driven look at whether OBs hold up under order flow.
- Best ICT Scanner: How to Choose — how to evaluate scanners once you know order flow's limits at scale.
- Order Block Scanner: Real-Time OB & FVG — the applied step: automating OB and FVG detection market-wide.
- Do LiquidityScan's Order Block Detections Hold Up? A Data-Driven Look — a related angle on order block detection win rate.
- Who Is LiquidityScan For? Day Traders, Swing Traders and Part-Time Traders — Clarifies which trader profile fits LiquidityScan after comparing scanner and order-flow tools.