
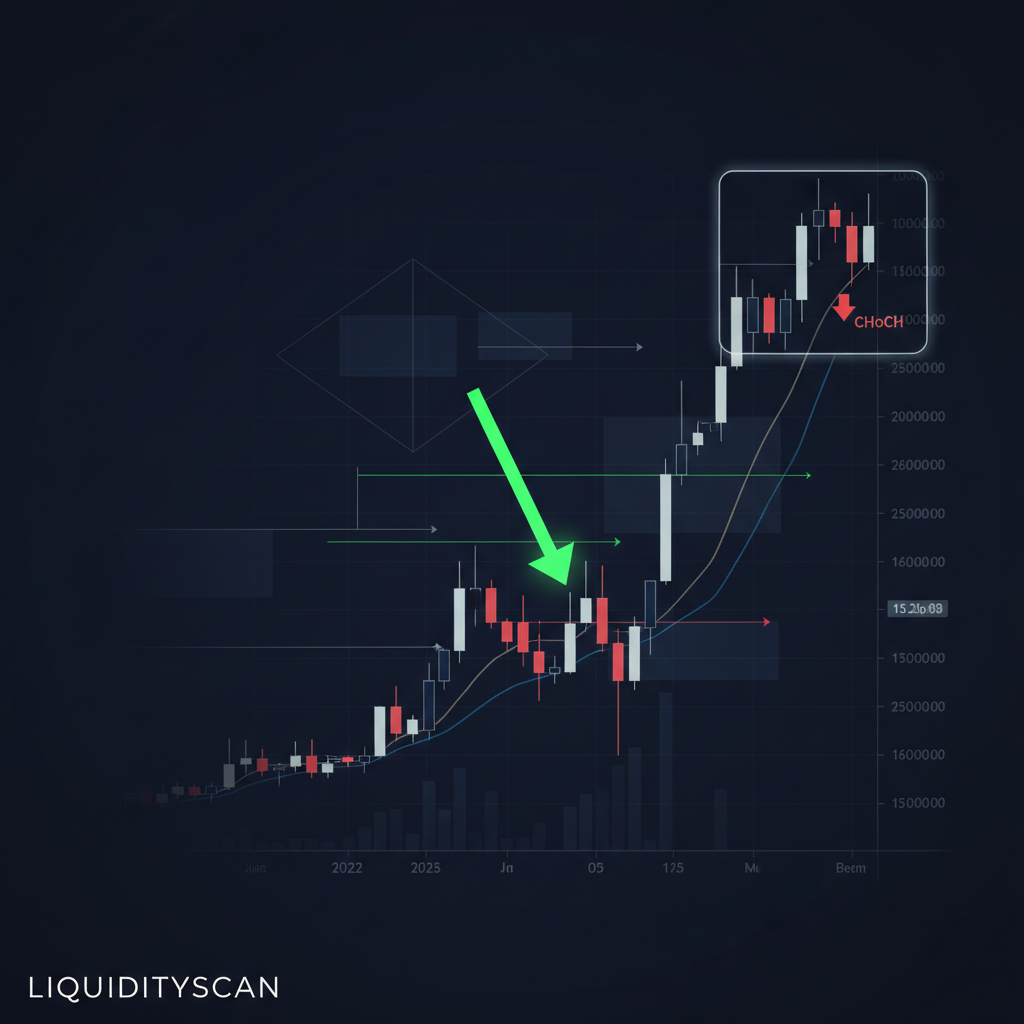
Beyond the Three-Candle Pattern: Anatomy of a Potent FVG
Any trader with a few months of screen time can spot a Fair Value Gap. Spotting it is step one of ten. The harder question is whether that gap can actually hold as support or resistance. An FVG is the residue of aggressive, one-sided order flow — a footprint left by large institutions shoving the market with enough force to leave a void in price delivery. That ties straight into modern market microstructure, where price discovery often happens in violent bursts, something research on high-frequency trading has documented in detail. (SSRN)
A weak FVG is usually nothing more than a pause inside a ranging market. A potent one — the kind that anchors a major swing — carries specific fingerprints tied to the flow that created it.
Start with the displacement. The candles forming the gap should be large, decisive, and close near their highs or lows. That tells you opposition was absent. A string of small, grinding candles that happen to leave a gap is not the same animal as a single explosive candle that breaks structure. The explosive move is institutions willing to pay any price to get filled in one direction, leaving a vacuum behind them.
Then there's context. A powerful FVG is almost always preceded by a raid on liquidity. A bearish FVG that forms right after sweeping the Asian session highs or a key daily high carries far more weight than one that appears out of nowhere. That sequence — liquidity grab, then displacement — is a classic institutional template. The sweep clears out resting stop orders and supplies the fuel for the aggressive move, and the FVG is what gets carved out as price breaks structure.
Reading the Return: How Price Action Validates or Invalidates the Gap
An FVG is a point of interest, not an automatic entry. Validation comes from watching how price behaves when it returns to test the gap. This is where high-probability setups split off from inducement. The return trip is a story told by order flow, and your only job is to read it correctly.
Signs of Confirmation (The FVG is likely to hold):
- Deceleration and Compression: As price approaches the FVG, you want it to slow down. Bodies shrink, wicks stretch out. That fade tells you the momentum driving the retracement is running out of steam — the pressure is being absorbed as it nears the institutional level.
- Rejection at Key Levels: The edges of the FVG and its 50% midpoint (Consequent Encroachment) are the levels that matter. Watch whether price respects them. A sharp rejection — often a pin bar or an engulfing candle on a lower timeframe — is a strong tell that the original flow behind the FVG is re-engaging.
- Lower Timeframe Market Structure Shift: This is the gold standard. Say you're watching a 1H bullish FVG. As price dips into it, you drop to a 1M or 5M chart and wait for that lower-timeframe trend to flip. Price makes a lower low, taps the 1H FVG, then breaks the most recent 1M swing high. That's your confirmation — the first sign the larger institutional flow is taking back over. If you want the mechanics of what counts as a real shift, our breakdown of BOS vs. CHoCH spells it out.
Signs of Invalidation (The FVG is likely to fail):
- Acceleration into the Gap: If price speeds up as it heads toward the FVG, get cautious fast. Large impulsive candles driving into the gap suggest the FVG is the target — a pool of liquidity to run through, not a wall to stop at.
- Disrespect of Levels: Price slicing through the edge and the midpoint with no hesitation is a glaring red flag. When it treats the Consequent Encroachment like it isn't there, the FVG has probably failed and the opposing flow is in charge.
- Immediate Filling of the Void: If price enters the FVG and closes fully inside it — or out the other side — on the first attempt, the gap was often just an inefficient run that's now being balanced. That's especially likely when the move happens outside a key kill zone.
I've watched plenty of traders get torched shorting a bearish FVG on ES futures purely because it was sitting there, only to see price rip straight through. The tell was the same every time: no deceleration on the 1M or 5M as price approached. The algo was hunting a liquidity pool above the gap, and the FVG was just a stop along the way.
A Practical Framework: Validating a NAS100 FVG in the NY Session
Let's put this on a real chart. The NAS100 index futures (NQ) are known for clean, aggressive moves during the New York session, which makes them a near-perfect instrument for this kind of read.
The Setup: It’s 9:50 AM EST. Price has just taken out the pre-market highs set during the London close — a textbook Judas Swing engineered to harvest liquidity. Right after the sweep, price displaces hard to the downside, leaving a clean 5-minute bearish FVG and breaking the last meaningful swing low to print a Market Structure Shift (MSS).
That's a high-potential setup. But we don't drop a blind limit order to short at the FVG’s low — that's gambling. We wait for validation.
The Validation Process:
- Identify and Monitor: Mark the 5-minute FVG, paying close attention to its Consequent Encroachment (the 50% level). That's your zone of interest.
- Watch the Retracement: Price starts pulling back toward the FVG. Switch your focus to the 1-minute chart and dissect the order flow inside that retracement.
- Look for Deceleration: As 1-minute price enters the lower part of the 5-minute FVG, are the bullish candles getting smaller? Are they printing long upper wicks, showing sellers pushing back? That's the first sign of absorption. If instead you're seeing large, explosive 1M candles, the setup is much weaker.
- Pinpoint the LTF Shift: The A+ confirmation is a change of character on the 1-minute chart *inside* the 5-minute FVG. Price pushes into the gap, fails to take out a small 1M swing high, then breaks the last 1M swing low. That micro-breakdown is your signal the larger bearish flow is resuming control. The entry can then be taken on the small 1M FVG that forms as part of the 1M breakdown — the same logic we cover in the dedicated FVG entry strategy.
This disciplined, multi-timeframe approach turns the FVG from a static pattern into a dynamic event. You're no longer trading a shape on a chart; you're reacting to a confirmed shift in institutional order flow — the kind of "why" behind a move that exchanges like CME Group push traders to understand. (CME Group). Tracking all of this by hand across multiple assets is brutal. That's exactly why we built the CISD (Change in State of Delivery) engine into the LiquidityScan platform. It's designed to flag these lower-timeframe shifts in order flow the moment they fire inside a higher-timeframe PD array like an FVG, giving you data-driven confirmation without parking your eyes on the chart all day.
Wait for order flow to validate the gap and you filter out the low-probability trades, lining yourself up with confirmed institutional intent instead. It takes patience, but that patience is the foundation of trading Smart Money Concepts like a professional.