
How Do You Identify an Order Block on a Chart?
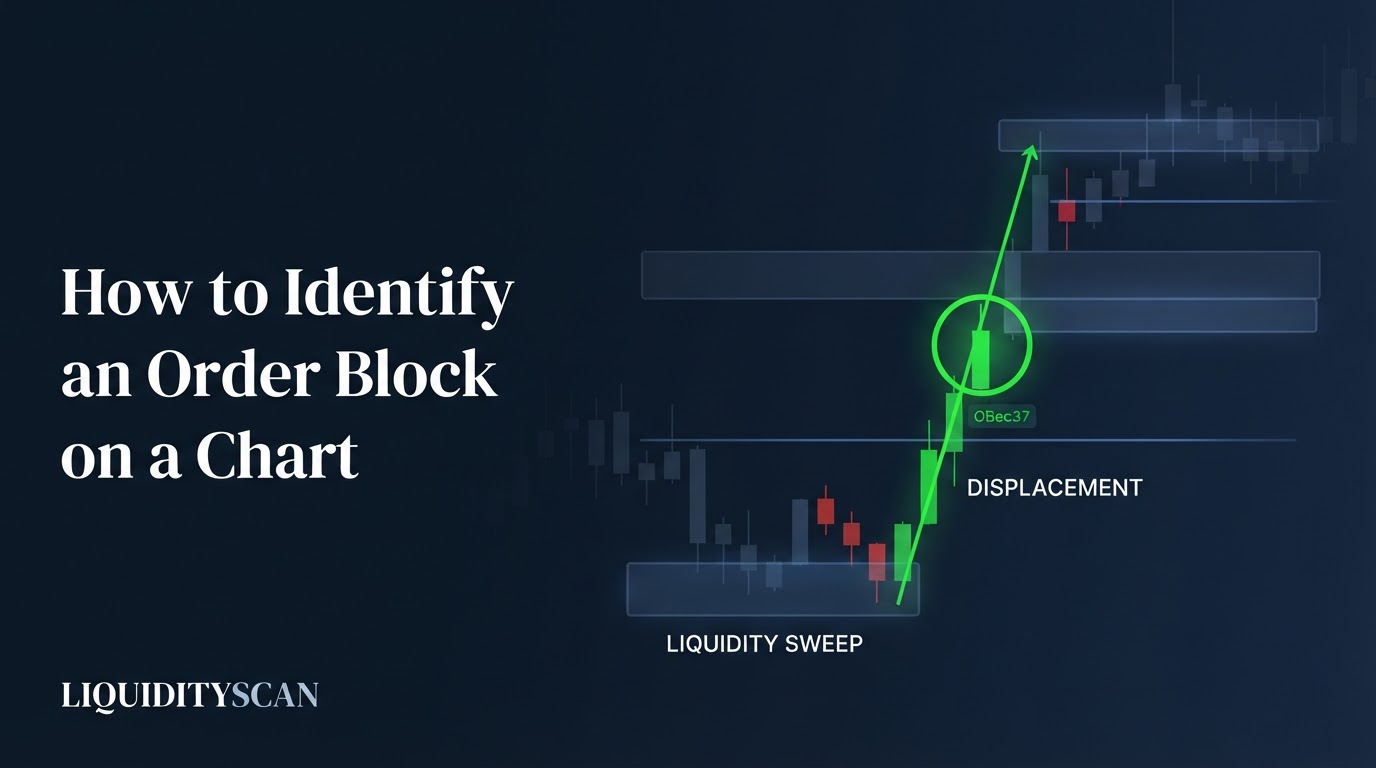
To identify an order block, find a displacement leg first, confirm the leg swept liquidity at its origin, mark the last opposite-direction candle before the leg, verify the move broke structure or left a Fair Value Gap (FVG), then draw the zone from open to extreme.
Most traders run this process backwards. They scan for large red or green candles, box them, and then look for reasons the zone might matter. That produces charts wallpapered with rectangles and no way to rank them. The professional workflow inverts it: you never hunt candles — you hunt impulses, and the impulse tells you which candle qualifies.
This guide assumes you already know what an order block is and why institutional execution leaves one behind. What follows is the pure identification procedure: the five steps in order, the timeframe workflow, a grading checklist, the disqualifiers, and a worked BTCUSDT walkthrough with exact levels.
The 5-Step Order Block Identification Procedure
Run these steps in sequence, every time. Each step is a filter; a candidate that fails any one of them gets deleted, not downgraded. The order matters because steps 1 and 2 eliminate most of what beginners would otherwise mark.
- Find the displacement leg — hunt impulses, not candles.
- Verify liquidity was taken at the leg's origin.
- Locate the last opposite candle before the leg.
- Verify the structural consequence (BOS or FVG).
- Mark the zone: open-to-extreme, plus the mean threshold line.
Step 1: Find the Displacement Leg — Hunt Impulses, Not Candles
Scan the chart for legs, not candles: sequences where price covers unusual ground fast. Practical definitions of displacement: a single candle whose body is at least ~1.5× the 14-period ATR, or three-plus consecutive same-direction closes with expanding bodies and minimal overlap.
The mechanism is what you are actually detecting. Displacement means orders were filled aggressively against available liquidity — someone paid up to get size done, which is the footprint of institutional participation. A slow drift covers the same distance without that urgency, and slow drifts do not leave defended origins. No impulse, no order block. Work the chart leg by leg and only then zoom in.
Step 2: Verify Liquidity Was Taken at the Origin
Look left from the leg's launch point. For a bullish candidate, the origin must have traded below something: a prior swing low, equal lows, a session low, or an old daily low. For a bearish candidate, mirror it — the origin wick must have run a prior high.
The mechanism: large orders need resting counterparty liquidity to fill. Sell stops cluster below equal lows and swing lows; sweeping them supplies the sell-side volume a buyer needs to accumulate without slippage. That is why a liquidity sweep at the origin is the single strongest quality signal an order block can have. If the leg launched from clean mid-air with nothing taken, skip the candidate entirely.
Step 3: Locate the Last Opposite Candle Before the Leg
Only now do you look at individual candles. For a bullish order block, isolate the last down-closed candle immediately before the displacement leg — typically the candle whose low is the origin of the move, often the one that performed the sweep itself. For a bearish order block, the last up-closed candle before the drop.
Two edge cases. If several small opposite candles cluster at the origin, use the one that printed the extreme (the lowest low or highest high); treating the whole cluster as one zone is acceptable but widens your risk. If the final opposite candle is a doji with a long sweep wick, it still qualifies — the wick is part of the story, not a defect.
Step 4: Verify the Structural Consequence (BOS or FVG)
The leg must have done something structurally. Two acceptable proofs: it closed through a prior swing point — a Break of Structure (BOS) — or it moved so fast it left a Fair Value Gap inside the leg. Ideally both.
This step separates repricing from rotation. A push that stalls under the prior swing high and leaves no gap is just movement inside the existing range; the origin candle carries no special information. A leg that breaks structure or leaves an imbalance forced the market to a new valuation, and the candle that started it becomes a level the originator has an interest in defending.
Step 5: Mark the Zone — Open to Extreme, Plus the Mean Threshold
Draw the rectangle from the opposite candle's open to its extreme. Bullish: from the open of the last bearish candle down to its low, including the full sweep wick. Bearish: from the open of the last bullish candle up to its high. Bodies-only marking is a common shortcut that puts your stop inside the real zone.
Then add the mean threshold: a horizontal line at the 50% level of the zone. It gives you two reference behaviors on the return: reactions from the upper half signal strong demand, while a candle closing through the mean threshold degrades the zone and a close beyond the extreme invalidates it.
The Timeframe Workflow for Identifying Order Blocks
Identify on 4H and 1H; refine on 15m. Higher-timeframe order blocks form from larger executed volume, survive more noise, and produce far fewer false candidates — a 4H chart of BTCUSDT might show two or three valid zones a week where a 5m chart shows dozens a day, most of them meaningless.
The refinement pass: once price approaches a 4H zone, drop to 15m and look inside the parent zone for the 15m structure that built it — usually a smaller order block or FVG at the same origin. Entering from that nested 15m zone can cut stop distance from over 1% to under 0.4% on crypto pairs, often doubling or tripling reward-to-risk on the same idea.
Keep lifecycle expectations timeframe-consistent. A zone identified on 15m has a 15m life expectancy — hours, not weeks. Practical cadence: one weekly pass marking 4H zones, a daily pass on 1H, and 15m only at execution time.
How to Grade Order Block Quality: The Checklist
Identification tells you a zone exists; grading tells you whether it deserves capital. Score each surviving candidate against four binary checks:
- Fresh? The zone has never been retested since formation. First returns carry the best odds because whatever resting interest remains at the origin is still intact; every touch consumes some of it.
- Correct half of the range? Anchor the dealing range from the sweep low to the leg's high. A bullish order block should sit in discount (below the 50% equilibrium); a bearish one in premium. Zones on the wrong side fight the logic of institutional value.
- HTF aligned? The zone's direction agrees with daily and 4H structure. A bullish 1H order block inside a daily downtrend is a countertrend trade and should be graded down, not up.
- Displacement strength? The leg away measured at least ~1.5× ATR(14) or left a clean FVG. Weak departure predicts weak defense.
Four out of four is an A-grade zone. Three is tradeable with reduced size. Two or fewer means you keep the drawing for context but never execute against it. LiquidityScan's OB+ scanner applies exactly this sweep-plus-displacement filter across the full market automatically, which is useful for coverage — but you should be able to run the checklist by hand first.
What Disqualifies an Order Block Candidate?
Deleting bad candidates matters more than finding good ones. Four hard disqualifiers:
- No sweep at the origin. The leg launched from mid-air without taking a prior low, equal lows, or a session extreme. Without engineered liquidity there is no evidence of institutional fill — it is a momentum candle, not an order block.
- Drift-away instead of displacement. Price left the candle in overlapping, small-bodied candles. If you have to squint to call it an impulse, it is not one.
- Already mitigated. Price has returned and traded through the zone once. Whatever orders defined it are spent; a second visit is trading a memory.
- Mid-range location. The zone sits at equilibrium of the current dealing range. There is no positional edge, and unswept liquidity remains on both sides, so price has reasons to trade straight through it.
A fifth soft disqualifier: the zone points directly into a fresh higher-timeframe zone of the opposite type — a 15m bullish order block sitting just below a fresh 4H bearish one is usually fuel, not support.
Marking Conventions and a Worked BTCUSDT Walkthrough
Conventions first, because sloppy marking corrupts good identification. Extend rectangles right only until mitigated or invalidated, then delete them — dead zones are chart noise. Label each box with timeframe and type ("1H OB, swept EQL"). Draw the mean threshold as a dashed line. Set a price alert at the zone's proximal edge instead of watching the chart.
Now the walkthrough, on BTCUSDT 1H. Price has printed equal lows at 64,200 — tested twice over two days, a visible pool of sell-side liquidity. During the New York session, a bearish candle drives through them and wicks to 64,050: the sweep. That candle opens at 64,310 and closes at 64,180.
The next three candles rally hard to 65,420. The largest has a body of roughly 690 points against a 1H ATR(14) of about 380 — about 1.8× ATR, clean displacement. The move closes above the prior 1H swing high at 65,050, printing a BOS, and leaves an FVG between 64,610 and 64,780. Every filter passes.
Marking: the last bearish candle before the leg is the sweep candle itself. Zone = 64,310 (open) down to 64,050 (wick low), a 260-point box. Mean threshold at 64,180. Grading: fresh, in discount (equilibrium of the 64,050–65,420 leg sits at 64,735), aligned with a bullish 4H structure, displacement 1.8× ATR — four for four.
Ten hours later price retraces to 64,290, holds above the mean threshold, and resumes higher. The 15m refinement inside the box would have offered an entry near 64,270 with a stop under 64,040 — under 0.4% of risk.
The 3 Most Common Order Block Identification Errors
Error 1: marking every opposite candle before every rally. This is what skipping steps 1 and 2 looks like. The result is fifteen rectangles per chart and zero information, because a zone that required no liquidity and produced no displacement is indistinguishable from noise. The filter is the edge — the drawing is just bookkeeping.
Error 2: bodies-only zones that exclude the sweep wick. The wick below the body is precisely where the liquidity was taken, and price frequently returns to it. Traders who mark body-to-body place stops inside the true zone and get clipped by the exact mechanism the order block was built on, then conclude order blocks "don't work."
Error 3: timeframe mixing. Identifying a zone on 4H, then abandoning it because a 1m candle wicked through the mean threshold — or refining to a 15m entry and expecting a 4H-sized reaction from a 15m zone. Judge each zone by closes on the timeframe that created it, and size expectations to that timeframe.
Knowing how to identify an order block is not about spotting a special candle — it is a disciplined, five-step audit of an impulse: displacement, sweep, last opposite candle, structural consequence, and a properly marked zone with its mean threshold. Run the audit the same way every session and your chart will carry three or four zones that matter instead of thirty that don't.
Frequently Asked Questions
What if several opposite candles form before the displacement leg?
Use the candle that printed the extreme — the lowest low before a bullish leg or the highest high before a bearish one. That candle holds the origin of the move. Boxing the entire cluster is acceptable when the candles overlap tightly, but it widens the zone and your stop, so prefer the extreme candle for execution.
How long does an order block remain valid?
There is no fixed expiry. A zone stays valid until price mitigates it (returns and trades through it) or invalidates it (closes beyond its extreme on the formation timeframe). Practically, relevance decays with time and distance: a 1H zone from three weeks ago that price never approached is usually superseded by fresher structure.
Do order blocks appear on all markets and timeframes?
Yes — the sweep-and-displacement footprint appears anywhere resting orders cluster: forex majors, index futures, and liquid crypto pairs on any timeframe. Reliability scales with liquidity and timeframe. Thin altcoins and sub-5-minute charts produce many pattern-shaped candidates driven by noise, so most traders identify on 4H/1H and execute on 15m.
Is an order block the same as a supply and demand zone?
They overlap but are not identical. Both mark the origin of an impulsive move. An order block adds mandatory filters a generic demand zone does not require: a liquidity sweep at the origin, measurable displacement away, and a structural consequence such as a BOS or FVG. Every valid order block is a demand or supply zone; the reverse is not true.
Related query paths
Where to go next, in query-journey order — from the core definition through mechanics to application and evidence:
- What Is an Order Block? — the definition and institutional logic this identification workflow builds on.
- Displacement in ICT: Reading Institutional Intent — a deeper treatment of the impulse filter behind Step 1.
- Best Timeframe for Order Block Trading (ICT Guide) — expands the 4H/1H-to-15m workflow into a full timeframe playbook.
- The Core Order Block Validation Rule for SMC Traders — the single test that decides whether a marked zone is still tradeable.
- 3 High-Probability Order Block Entry Models — how to actually enter once an A-grade zone is marked.
- Is Order Block Strategy Profitable? A Data Look — honest evidence on whether the filtered zones carry a measurable edge.
- Bullish vs Bearish Order Block: How to Identify and Mark Each — how it connects to bullish vs bearish order block.
- How to Refine an Order Block: From HTF Zone to Sniper Entry — a closely related next step.