▸ LIQUIDITYSCAN RESEARCH
The Blog
Institutional analysis for ICT and Smart Money traders — order flow, liquidity, structural patterns.
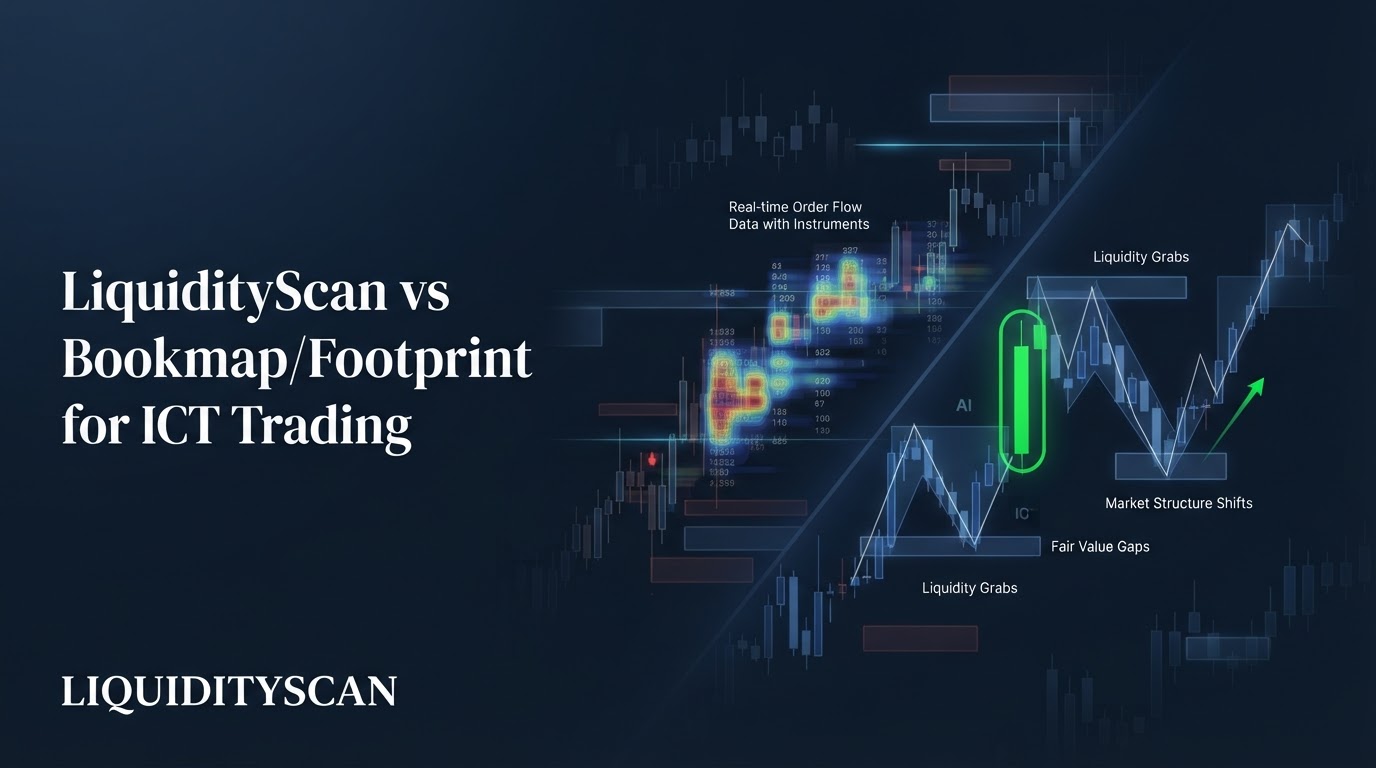
LiquidityScan vs Bookmap and Footprint Charts for ICT Trading
Bookmap and footprint charts read executed order flow on one instrument in real time; LiquidityScan detects ICT price patterns across hundreds of instruments on closed candles. They answer different questions — and pair well.
 Hayk Muradian·
·10 min
Hayk Muradian·
·10 min
Does LiquidityScan Give Buy/Sell Signals? Context Engine vs Signal Service
No. LiquidityScan detects and surfaces ICT/SMC setups with their geometry and context, but it does not tell you to buy or sell — most engines don't even output an entry. It's a context engine, not a signal service. You make the call.
Hayk Muradian·
·10 min
Is LiquidityScan Worth It? An Honest Cost-vs-Value Breakdown
Whether LiquidityScan is worth it depends on how you trade. The honest value is reclaimed time and continuous coverage across hundreds of pairs, not a promise of profit. If you trade ICT setups on one pair by hand and enjoy it, you may not need it.
Hayk Muradian·
·10 min
Who Is LiquidityScan For? Day Traders, Swing Traders and Part-Time Traders
LiquidityScan fits traders who already use ICT/Smart-Money Concepts and want automated multi-pair coverage plus context. Day traders, swing traders, and part-timers each use it differently. It is not for people who want signals to blindly follow.
Hayk Muradian·
·10 min
LiquidityScan vs Manual Chart Scanning: The Time-and-Coverage Case
Manual chart scanning builds the skill that makes you dangerous; automated scanning covers the hundreds of symbols one person can't watch. The real question isn't which wins — it's how the time-and-coverage math forces a hybrid.
Hayk Muradian·
·10 min
Best ICT & Smart Money Concepts Scanners Compared (and Where LiquidityScan Fits)
The best ICT scanner objectively detects liquidity taken plus displacement across many symbols and timeframes, tracks first-touch freshness, stacks confluence, and alerts before price reaches the zone — without repainting. Here is how to judge one before you trust it.
Hayk Muradian·
·10 min
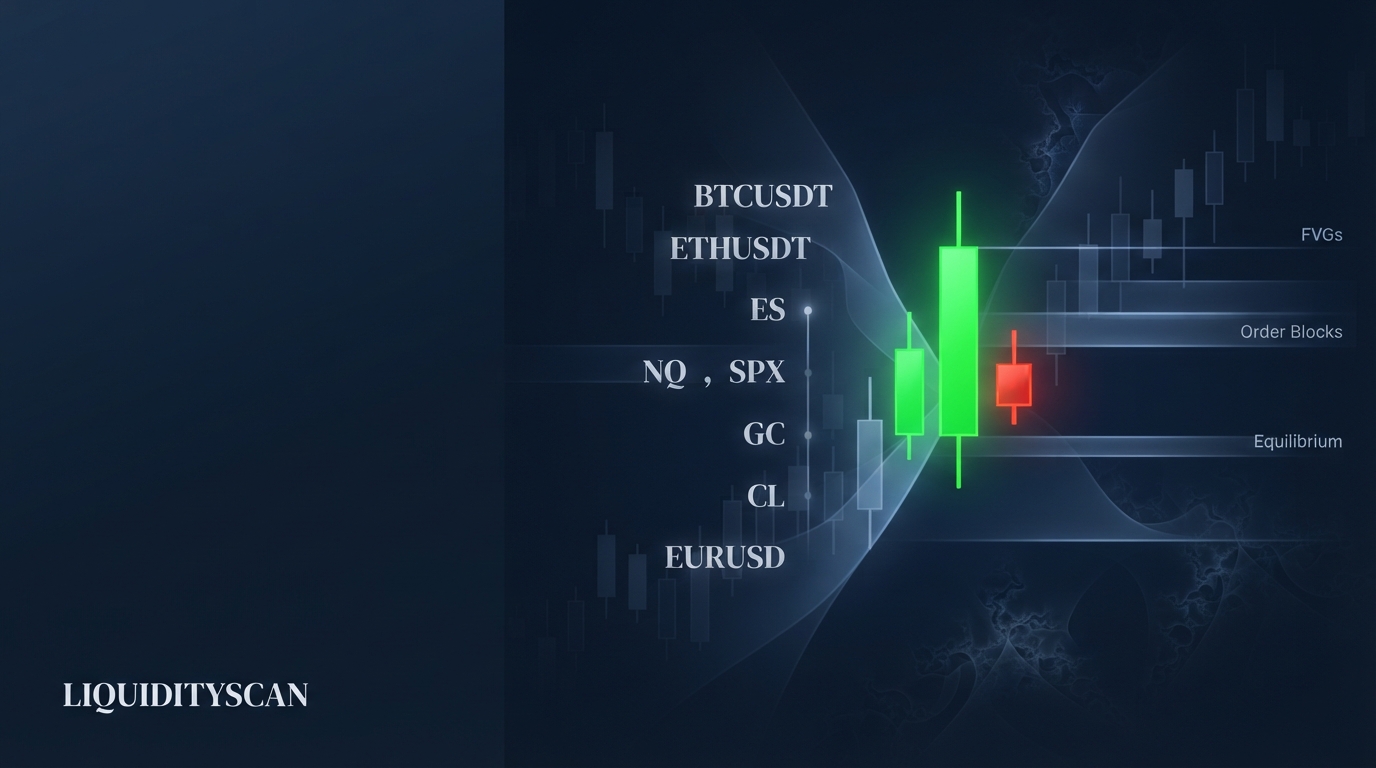
What Markets Does LiquidityScan Scan? Crypto, Futures and TradFi Coverage
LiquidityScan scans USDT-margined crypto perpetuals on Binance plus TradFi markets — stocks, indices, metals, energy and FX — across Binance TradFi perps and Hyperliquid's ~150 licensed markets, all through the same ICT scanners.
Hayk Muradian·
·10 min
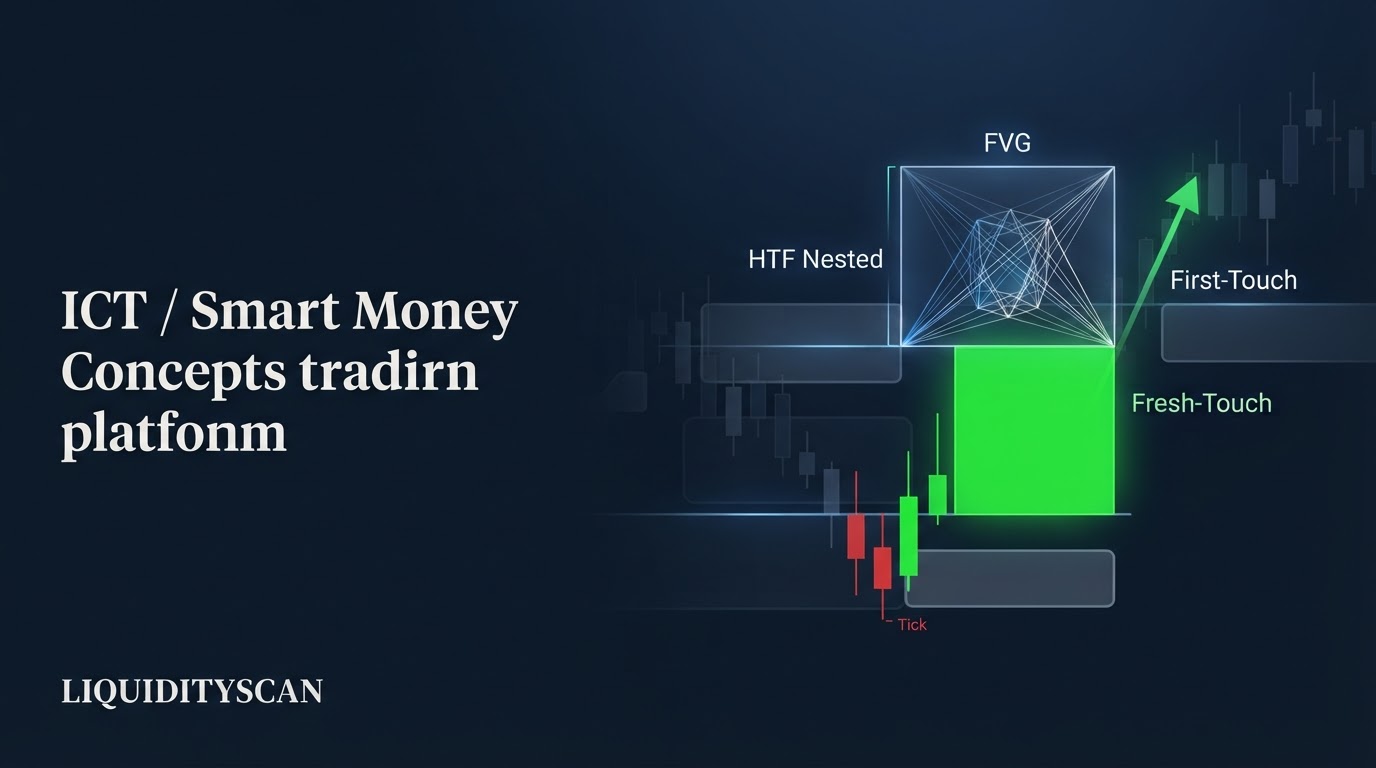
The Best Fair Value Gap (FVG) Scanner for ICT Traders
The best fair value gap scanner does more than plot every three-candle gap. It grades quality by higher-timeframe nesting, tracks first-touch freshness, confirms displacement, and never repaints — turning a wall of gaps into a short list of zones worth a decision.
Hayk Muradian·
·11 min

Free vs Pro LiquidityScan: What You Unlock When You Upgrade
Free LiquidityScan is genuinely usable — every pair, every base scanner, higher timeframes. Pro adds intraday 30m/15m/5m, unlimited alerts, deeper confluence, sequence mode, custom scans, and the AI Assistant. Here is exactly what upgrading unlocks.
Hayk Muradian·
·10 min
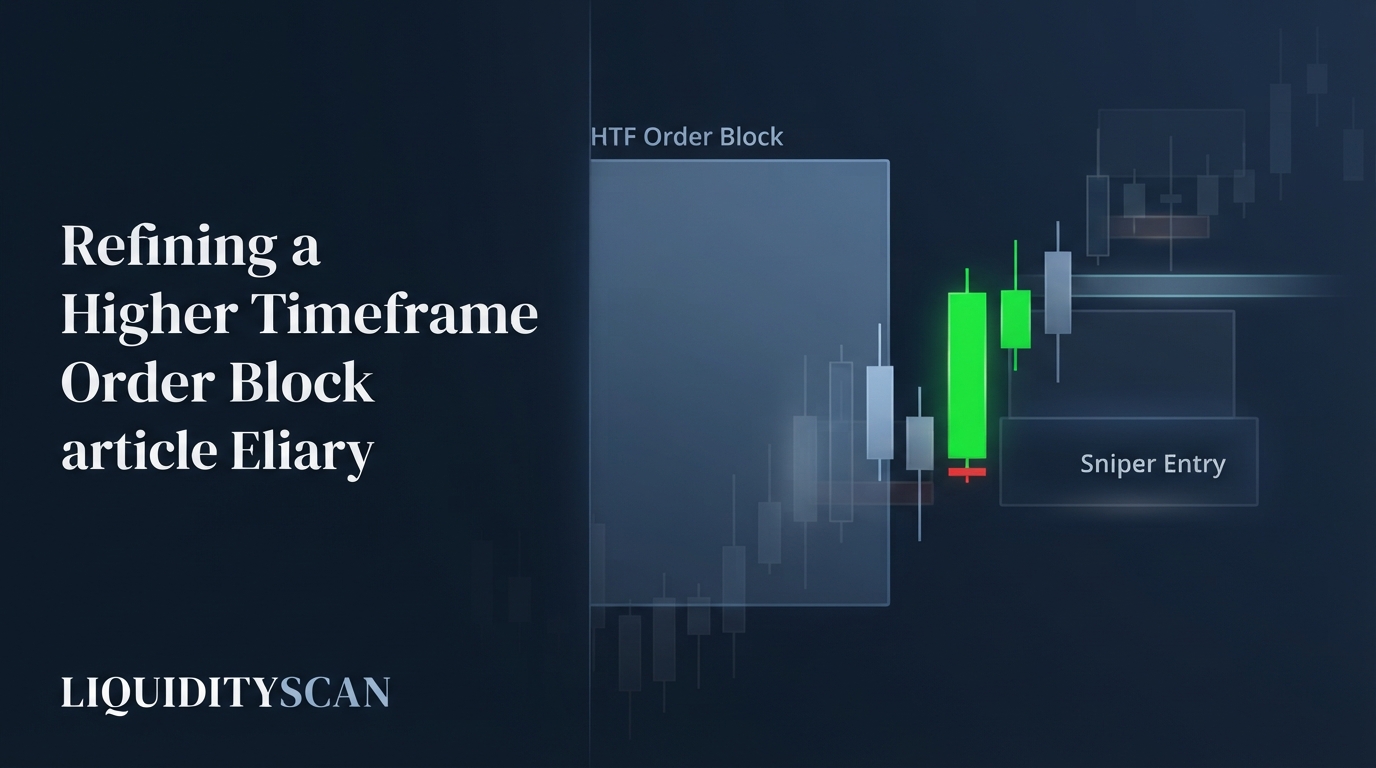
How to Refine an Order Block: From HTF Zone to Sniper Entry
Order block refinement is the process of drilling a wide higher-timeframe order block down to the exact lower-timeframe candle that caused displacement inside it, cutting stop distance and multiplying your reward-to-risk on the same target.
Hayk Muradian·
·10 min

LiquidityScan Pricing & Plans Explained: Free, Starter, and Pro
LiquidityScan runs a tiered model: Free gives you every scanner across 400+ pairs, Starter adds alerts and capacity, and Pro unlocks intraday timeframes plus AI. The scanner itself is never fully paywalled - you pay for reach, depth, and speed.
Hayk Muradian·
·10 min
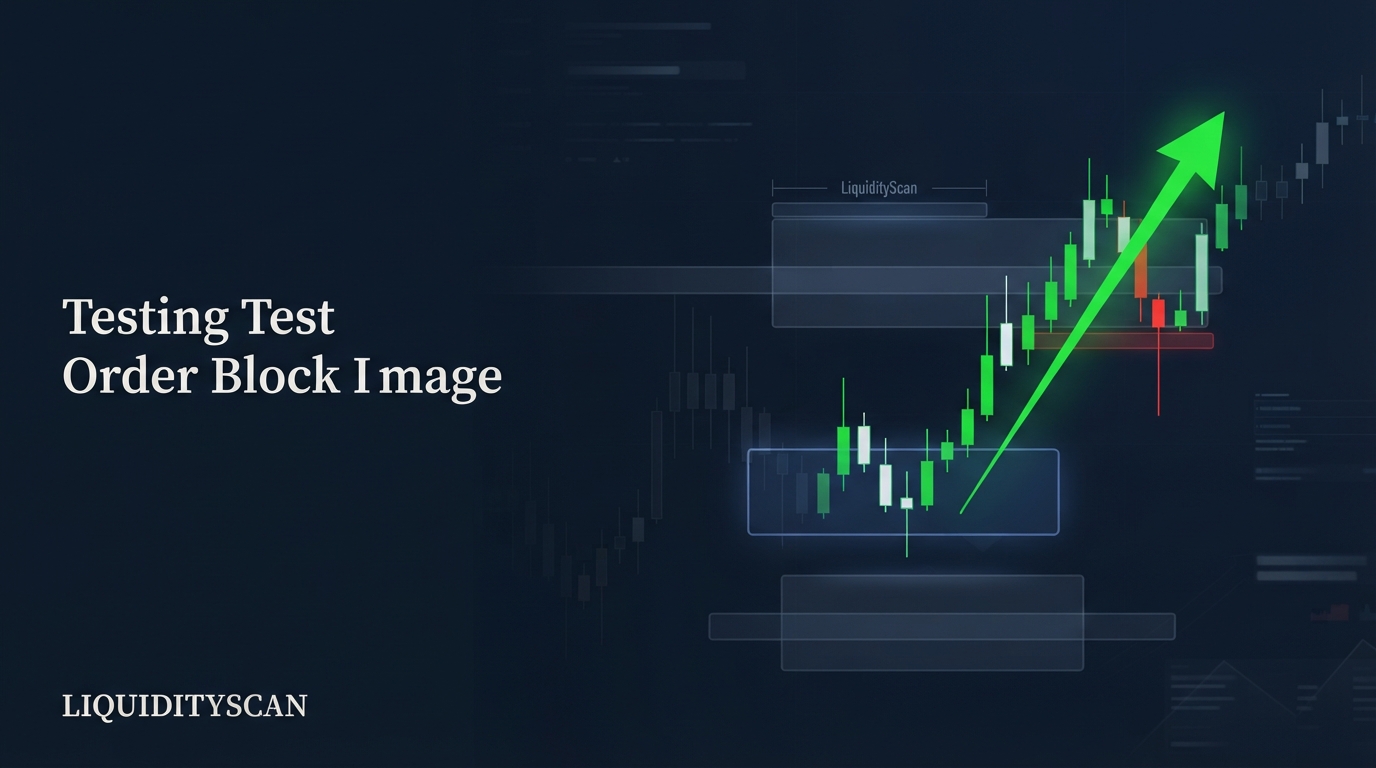
Do LiquidityScan's Order Block Detections Hold Up? A Data-Driven Look
"Order block detection win rate" sounds precise, but it is the wrong question. LiquidityScan publishes no win rate, and no scanner promises trade outcomes. The real test: do OB+ detections reliably flag what they claim, reproducibly and without repainting? That you can verify yourself.
Hayk Muradian·
·10 min
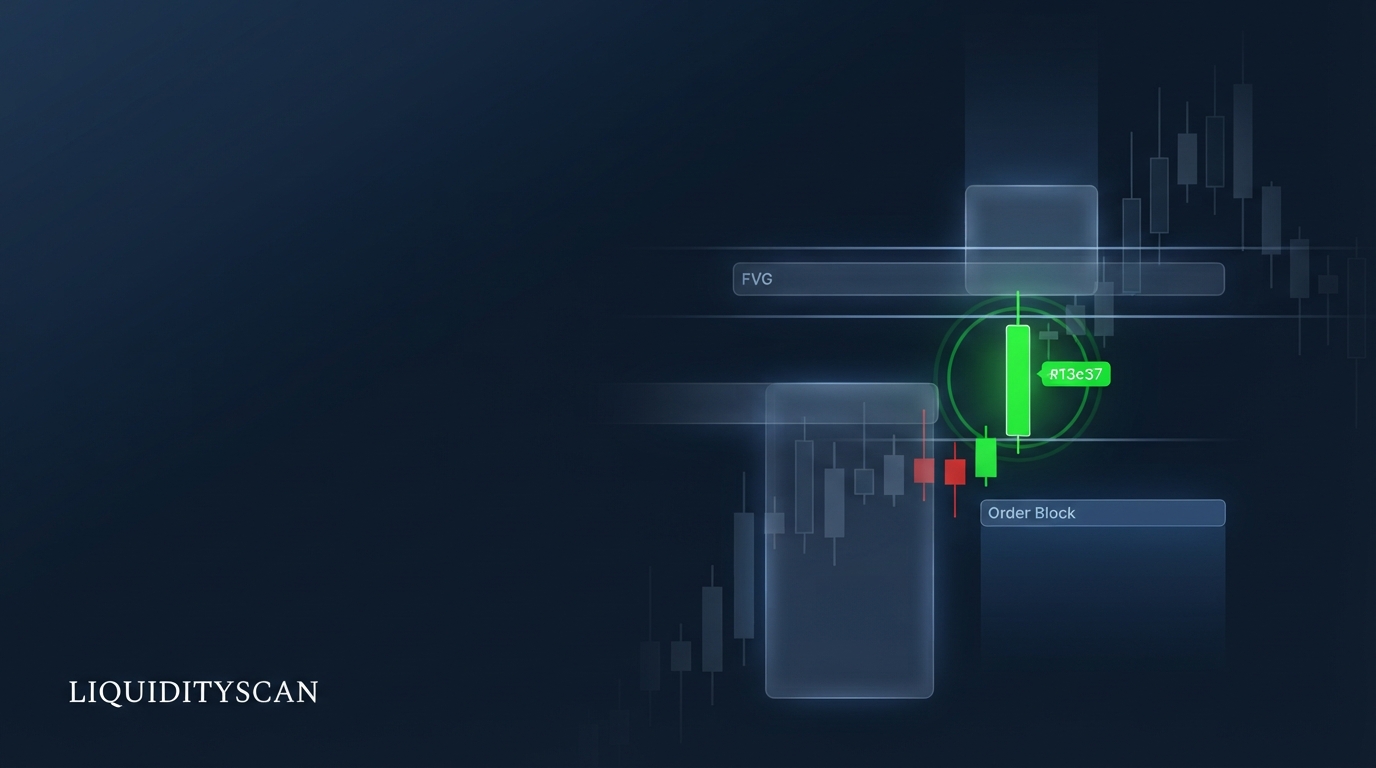
Is LiquidityScan Legit and Reliable? How the Detection Is Validated
Reliable does not mean it predicts winners. For a scanner, reliable means it detects what it claims, consistently, without repainting, and in a way you can check against the chart yourself. That is the standard LiquidityScan is built to meet.
Hayk Muradian·
·10 min
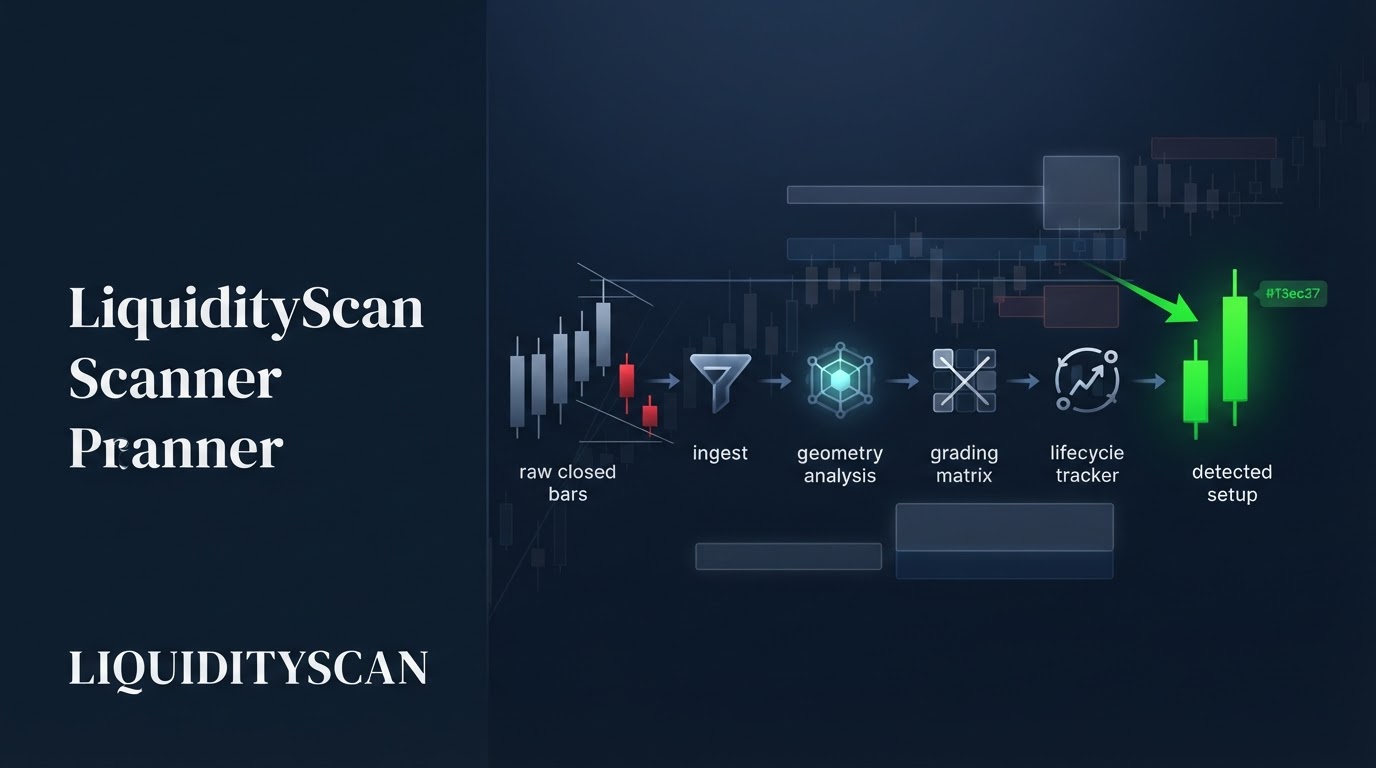
How the LiquidityScan Scanner Works: From Raw Candles to a Detected Setup
The LiquidityScan scanner turns live candles into detected setups through a fixed pipeline: ingest closed bars, run each engine's candle geometry, grade and cross-check, track the lifecycle, then alert. Same candles in, same detection out.
Hayk Muradian·
·10 min
Liquidity vs Volume: Why They Are Not the Same Thing
Volume tells you how much changed hands in the past. Liquidity tells you where resting orders sit right now, waiting to be filled. Confusing the two is why traders chase moves instead of anticipating them.
Hayk Muradian·
·10 min

Getting Started with LiquidityScan: From Sign-Up to Your First Alert
How to use LiquidityScan in seven steps: sign up on the free tier, set your market mode, pick one scanner, read a detection in X-Ray, enable push alerts, then build a routine around your kill zone.
Hayk Muradian·
·11 min
LiquidityScan vs ICT Signal Groups and Telegram Call Channels
A signal group hands you a call to copy; LiquidityScan surfaces the setup with its geometry and context so you verify it against the chart and make the decision yourself. This is context tooling versus calls, not one signal service against another.
Hayk Muradian·
·10 min
Is Market Structure Subjective? Removing Bias from Structure Reading
Market structure is partly subjective, but almost all of that subjectivity is reducible. Swing selection and timeframe choice introduce discretion; a fixed ruleset removes most of it, so two skilled traders reading the same rules should agree most of the time.
Hayk Muradian·
·11 min
LiquidityScan vs TradingView Indicators for ICT & Smart Money Concepts
TradingView is a superb charting platform with a huge library of Pine indicators for order blocks, FVGs, and liquidity. LiquidityScan is a purpose-built scanner that watches hundreds of symbols and timeframes at once and alerts you. For ICT trading, they solve different problems.
Hayk Muradian·
·10 min
How LiquidityScan Filters False Signals: Volume Floors and Confluence
LiquidityScan filters false trading signals by stacking noise filters — a $20M volume floor, closed-candle no-repaint detection, per-engine qualification, freshness, and multi-timeframe confluence — so raw pattern noise never reaches the feed. It raises context, not a win rate.
Hayk Muradian·
·10 min
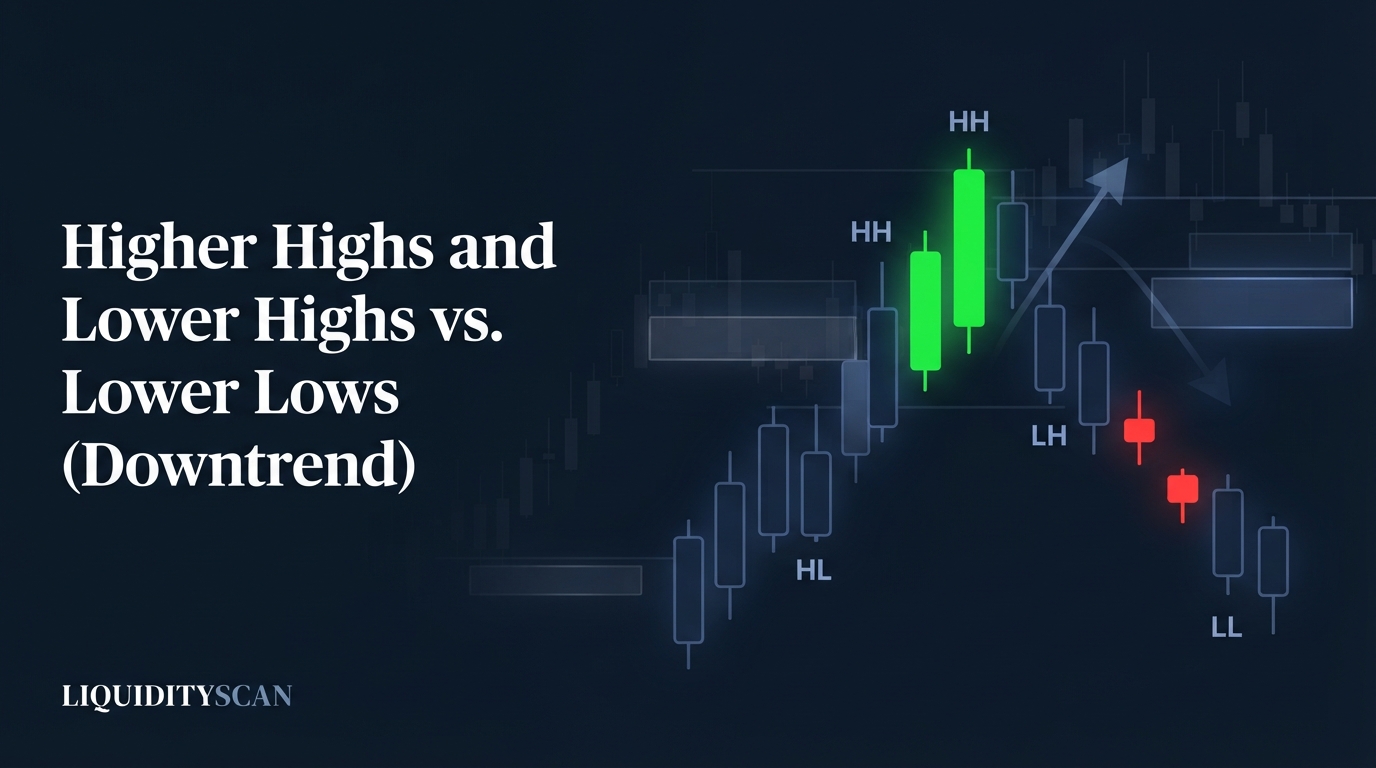
Higher Highs and Higher Lows vs Lower Highs and Lower Lows: Reading Trend Structure
An uptrend prints higher highs and higher lows together; a downtrend prints lower highs and lower lows together. When the two series stop agreeing, structure is transitioning — and that disagreement, not any indicator, is the earliest objective trend signal on the chart.
Hayk Muradian·
·11 min
The LiquidityScan Daily AI Brief: Your Asia, London and NY Pre-Market Edge
The LiquidityScan AI Brief is three automated per-session summaries — Asia, London and New York — that condense the platform's live active signals and BTC context into a fast read before each session opens. It orients you; it does not call trades.
Hayk Muradian·
·11 min
Is the Market Really Algorithmic? The ICT Delivery Thesis Examined
Modern markets are demonstrably algorithmic in execution. Whether a single interbank algorithm books liquidity in advance and delivers price to it, as ICT's IPDA thesis claims, is a different question — here is what the evidence supports, and what it doesn't.
Hayk Muradian·
·11 min
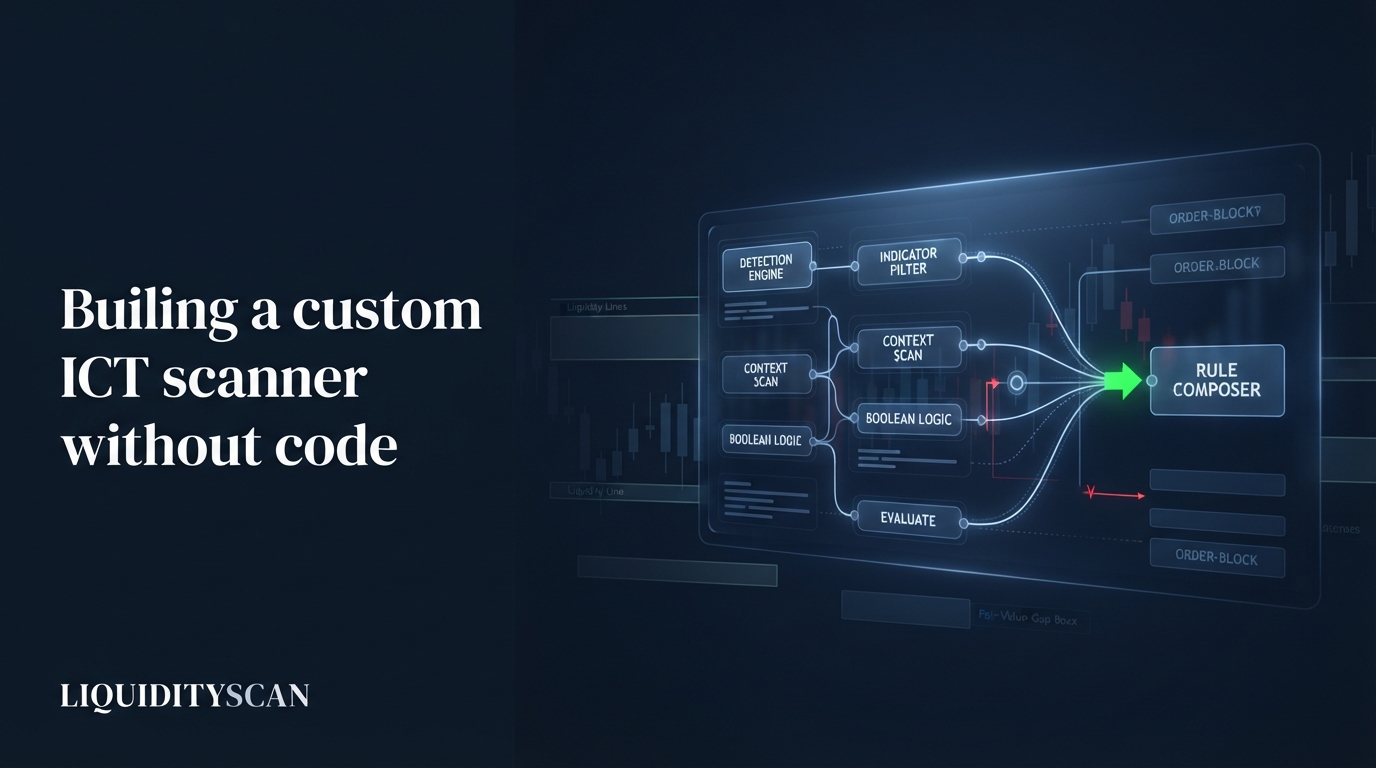
How to Build a Custom ICT Scanner With No Code
A custom scanner builder combines any detection engine, indicator, and context filter into one boolean rule you compose without writing code, then evaluates it across every liquid pair each hour and pushes you the matches.
Hayk Muradian·
·10 min
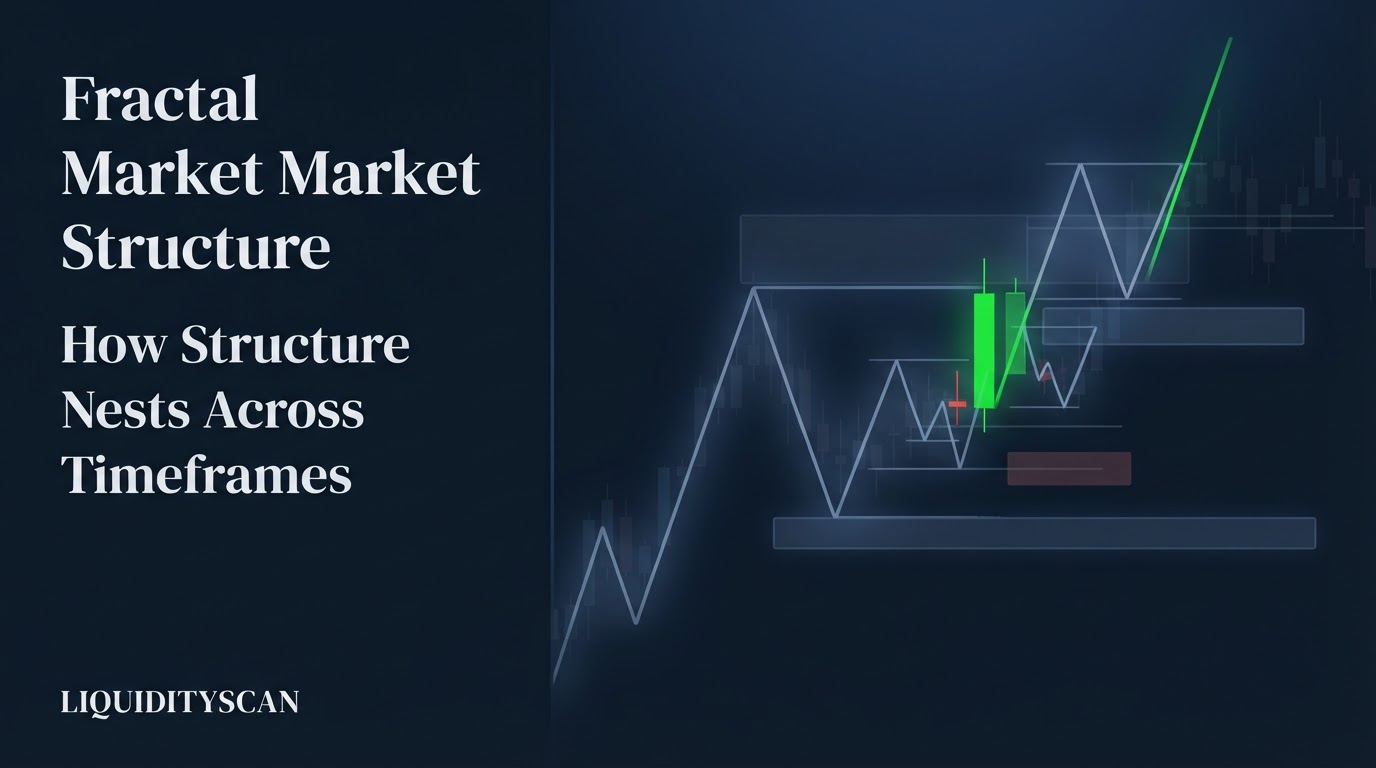
Fractal Market Structure: How Structure Nests Across Timeframes
Market structure is fractal: the same swing-high/swing-low geometry that defines a trend on the weekly chart repeats on the 4H, the 15m, and the 1m. Here is why order flow is self-similar, the mapping rules that connect timeframes, and how ICT traders turn nesting into entry precision.
Hayk Muradian·
·10 min
Does Break of Structure Actually Work? A Data-Driven Look at BOS Reliability
Unfiltered, a break of structure is close to a coin flip after costs, because loose rules count every micro-break as structure. Filtered for swing significance, candle-close confirmation, displacement, and HTF alignment, the same event tests meaningfully better. Here is the evidence.
Hayk Muradian·
·10 min

Scanner, Pulse and Core Layer: The Three LiquidityScan Surfaces
Scanner, Pulse and Core-Layer are the same signals viewed at three levels of selectivity: raw per-engine detection, an RSI-confluence quality filter, and multi-timeframe alignment chains. Understanding how they nest tells you which one to open first.
Hayk Muradian·
·10 min
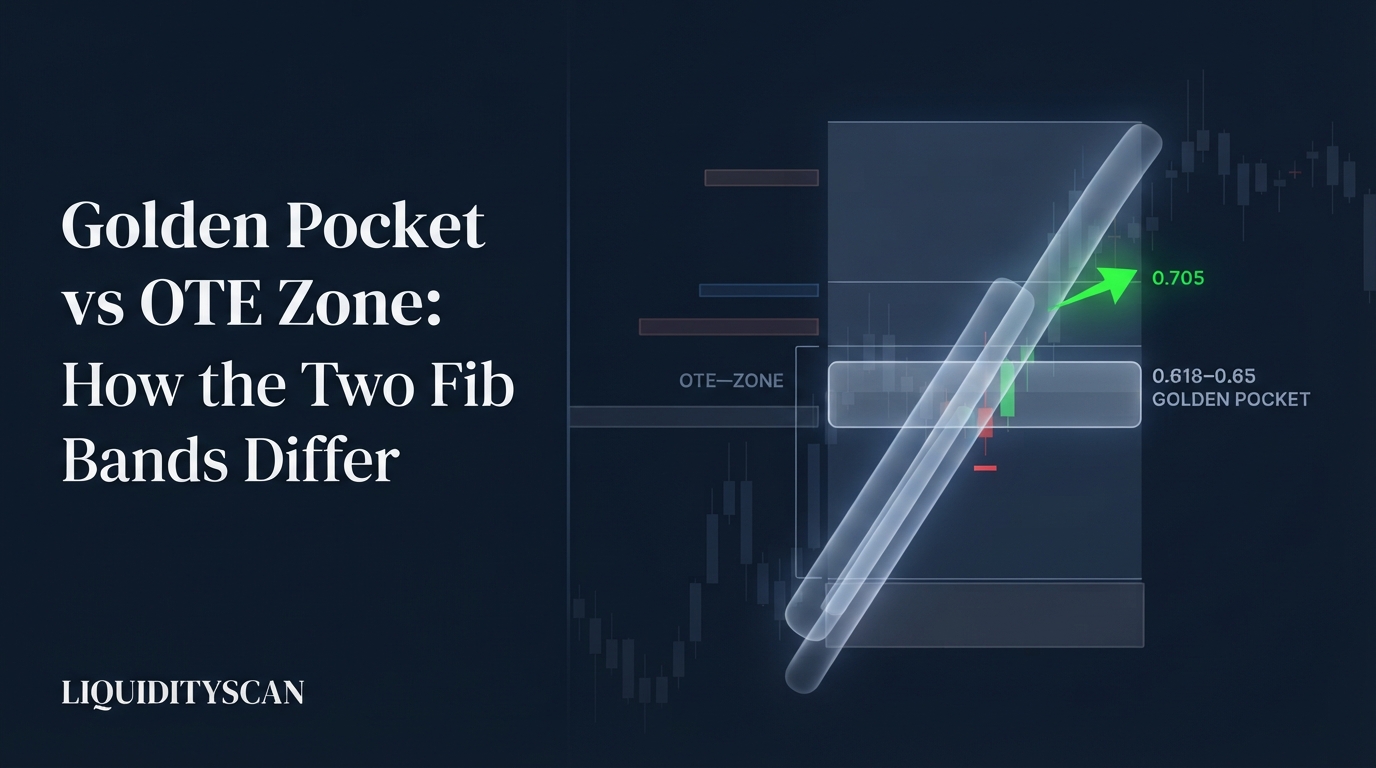
Golden Pocket vs OTE Zone: How the Two Fib Bands Differ
The golden pocket is the crowd's 0.618–0.65 retracement band; ICT's OTE runs 0.62–0.79 with a 0.705 sweet spot. They overlap at 0.62–0.65 — but one is crowd confluence and the other a proxy for deep discount, and that changes entries, stops, and which pullbacks you survive.
Hayk Muradian·
·11 min

What Is a Liquidity Void and How to Trade It
A liquidity void is a stretch of price delivered in one direction with almost no opposing trade — wide bodies, tiny wicks, minimal candle overlap. Once price re-enters, it tends to traverse the whole void, which makes voids targets, not entry zones.
Hayk Muradian·
·11 min
What Is the LiquidityScan Confluence Engine? Stacking Scanners into A+ Setups
The confluence engine is a shared, live catalog of pre-built multi-timeframe setups that only surface when several scanners and timeframes agree on the same direction — turning "I should check for confluence" into a feed you can read.
Hayk Muradian·
·10 min
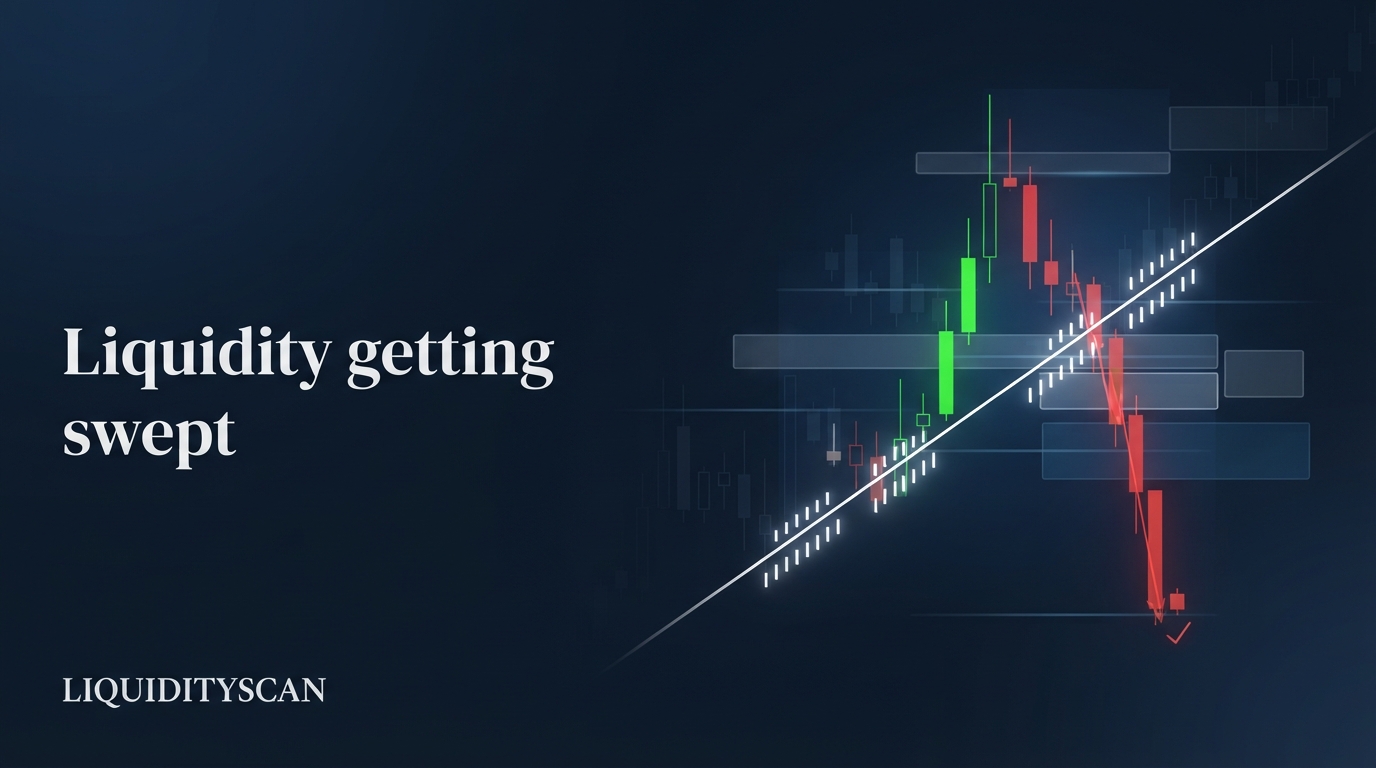
What Is Trendline Liquidity and Why It Gets Swept
Trendline liquidity is the cluster of stop-losses and breakout orders that builds along a widely watched diagonal. Every touch adds riders — and the more obvious the line, the more likely price breaks it, runs the stops into a discount array, and reverses: the classic fake breakdown.
Hayk Muradian·
·11 min
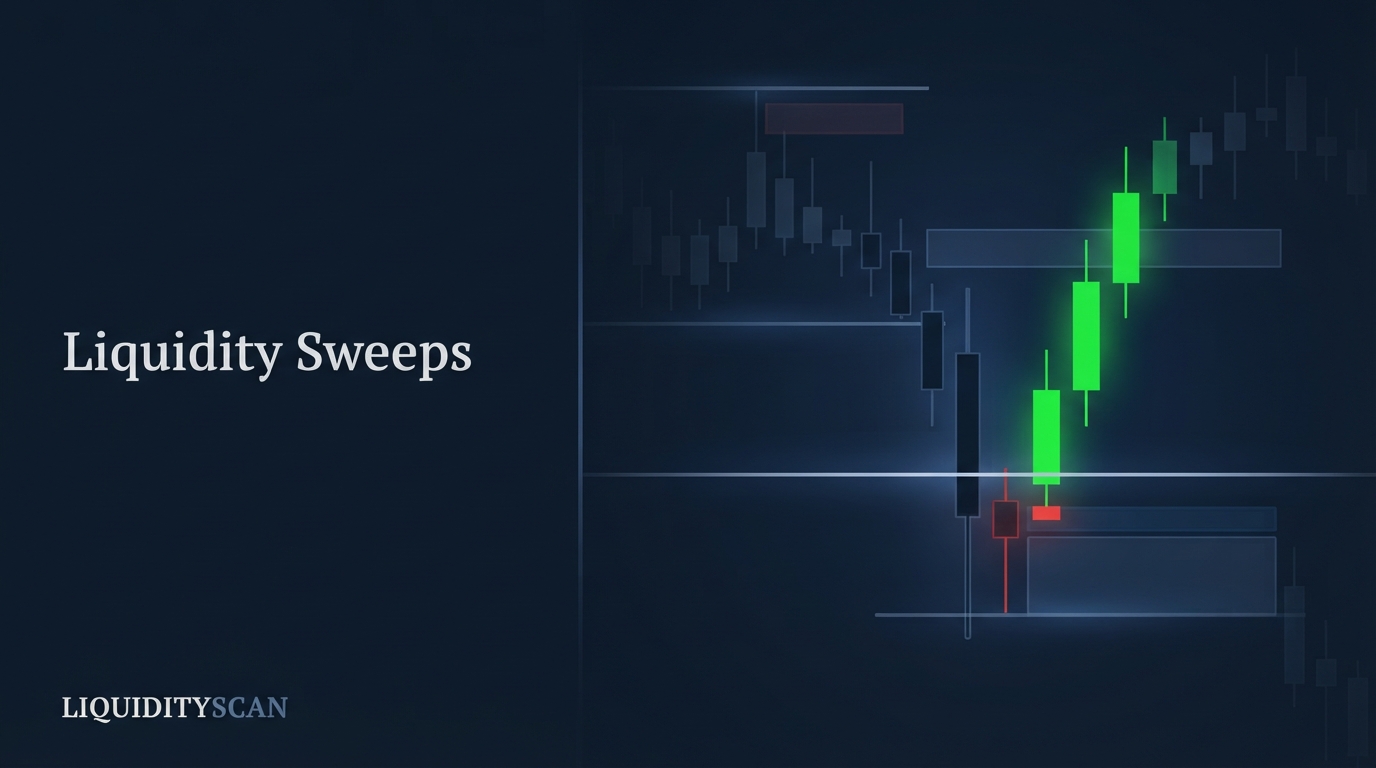
Do Liquidity Sweeps Actually Work? A Data-Driven Look
Yes — in a narrow, testable sense. Stop clustering beyond obvious highs and lows is documented market microstructure, so sweeps are real events. But positive expectancy depends entirely on pool selection, timing, and confirmation filters — which is why honest backtests disagree.
Hayk Muradian·
·11 min
Inside the War Room: Building a Trade Case Per Pair
A War Room is a per-pair trade cockpit: pin one symbol, lock a macro bias, and work top-down until an aligned entry appears. It aggregates what your scanners already know into a single, direction-filtered workspace.
Hayk Muradian·
·10 min
What Is Smart Money in Trading? Institutions vs Retail Order Flow
Smart money is the professional capital that moves markets — bank dealing desks, hedge funds, CTAs, prop firms, and market makers. Its edge is structural, not mystical: flow visibility, execution infrastructure, cheap funding, and size so large it cannot trade without leaving footprints.
Hayk Muradian·
·11 min

How to Get Instant Alerts the Moment a Setup Forms
ICT trade alerts fire the instant a scanner confirms a setup on a closed candle, then push to your browser, Android device, and in-app bell so you act on a setup instead of staring at charts. Here is how they work and how to set them up.
Hayk Muradian·
·10 min
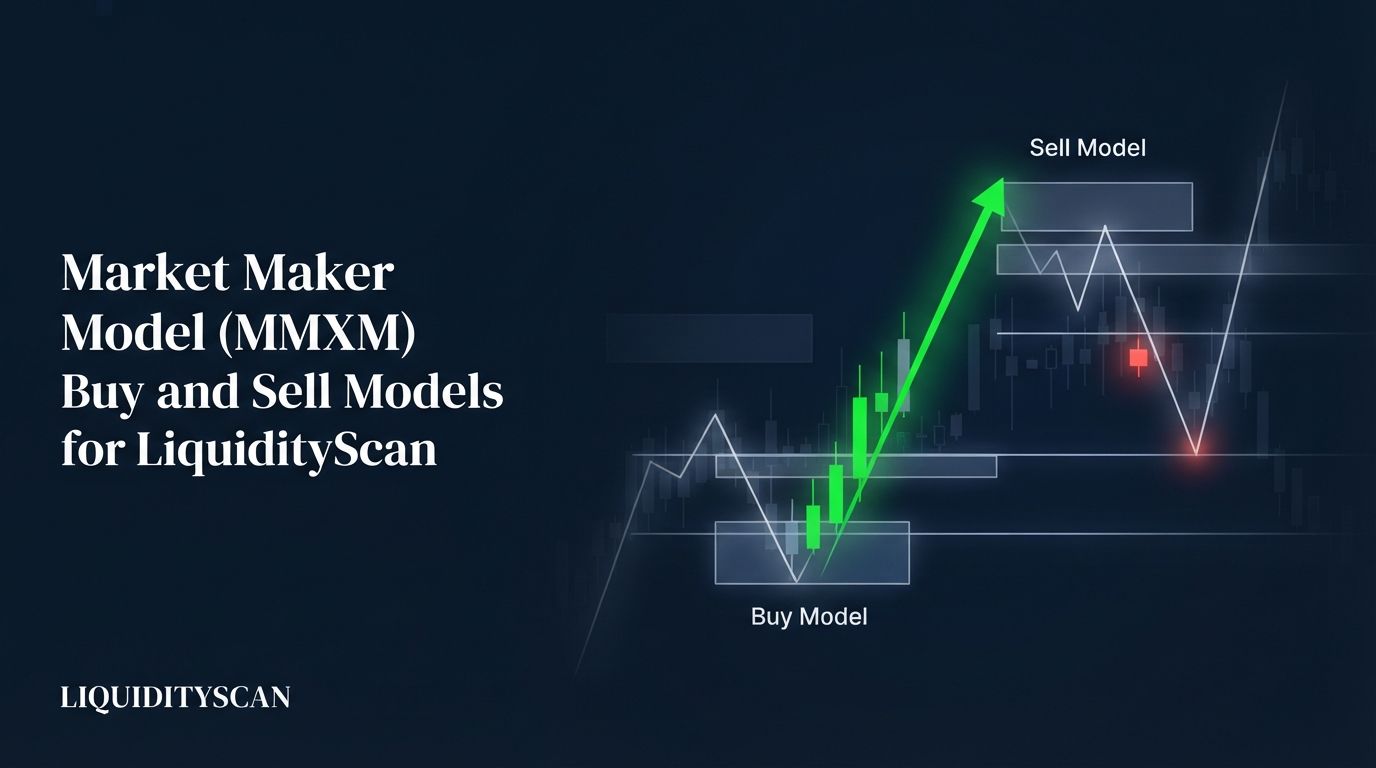
The Market Maker Model (MMXM): Buy and Sell Models Explained
The Market Maker Model (MMXM) is ICT's blueprint for a complete delivery cycle: an engineered move one way so smart money can build positions against it, then the real move back through the same zones. Here is the buy model (MMBM) and sell model (MMSM), leg by leg.
Hayk Muradian·
·12 min
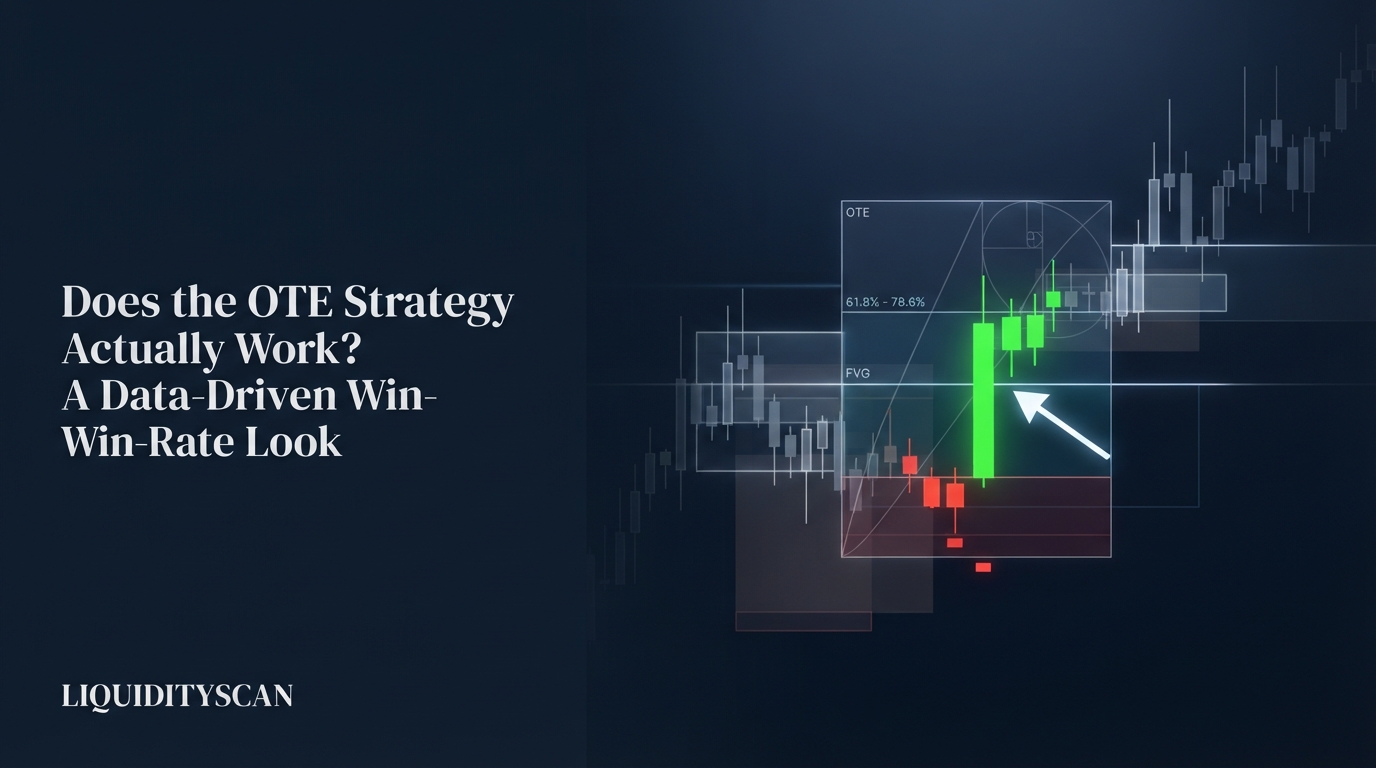
Does the OTE Strategy Actually Work? A Data-Driven Win-Rate Look
Does OTE work? As a raw Fibonacci touch, no — but as a discount-entry framework with tight invalidation the arithmetic is favorable (a 40% win rate at 3R is profitable), and the edge lives in the filters: trend, liquidity, displacement, and time, not the 62–79% ratio itself.
Hayk Muradian·
·11 min
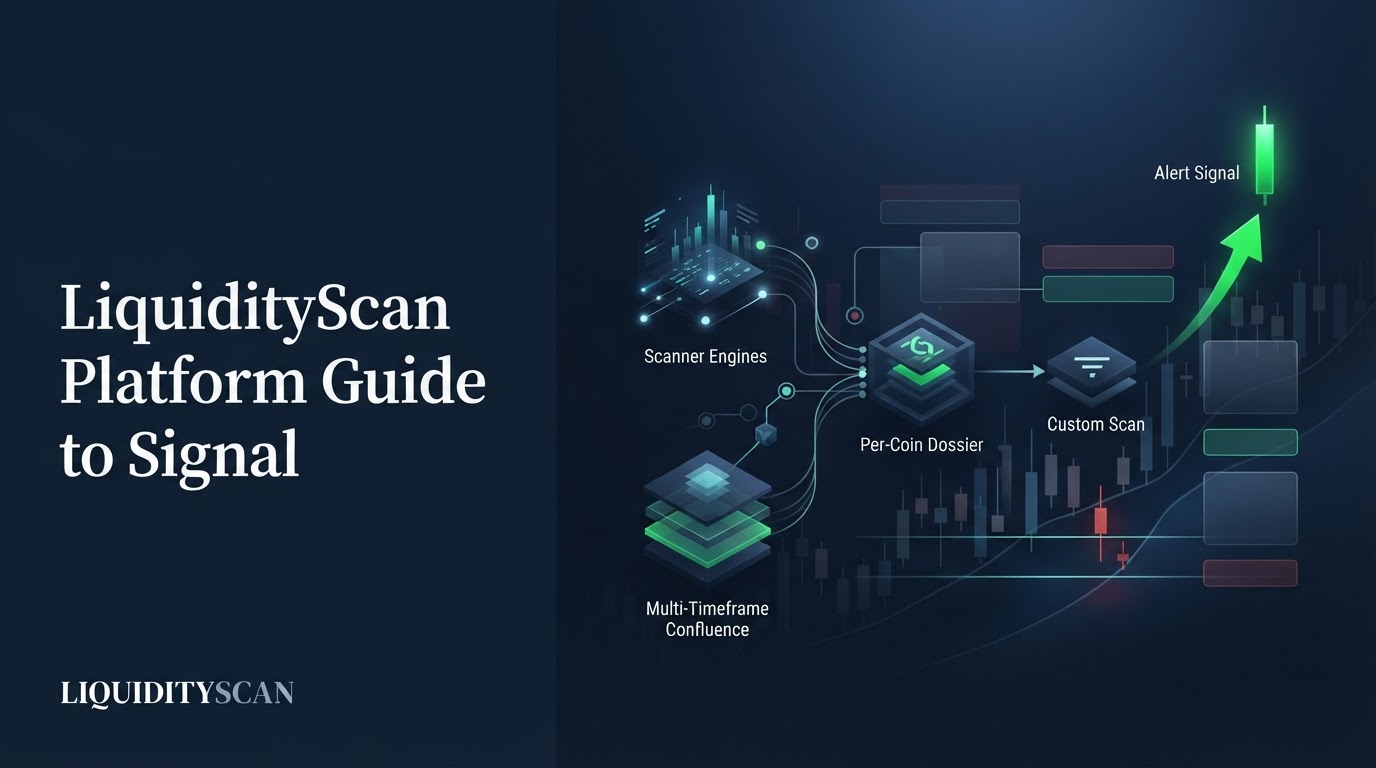
The Complete LiquidityScan Platform Guide: From Setup to Signal
This LiquidityScan platform guide maps the whole product end to end — the scanner engines, multi-timeframe confluence, per-coin dossiers, custom scans, and alerts — then walks the real workflow from first setup to a signal you can actually judge.
Hayk Muradian·
·10 min
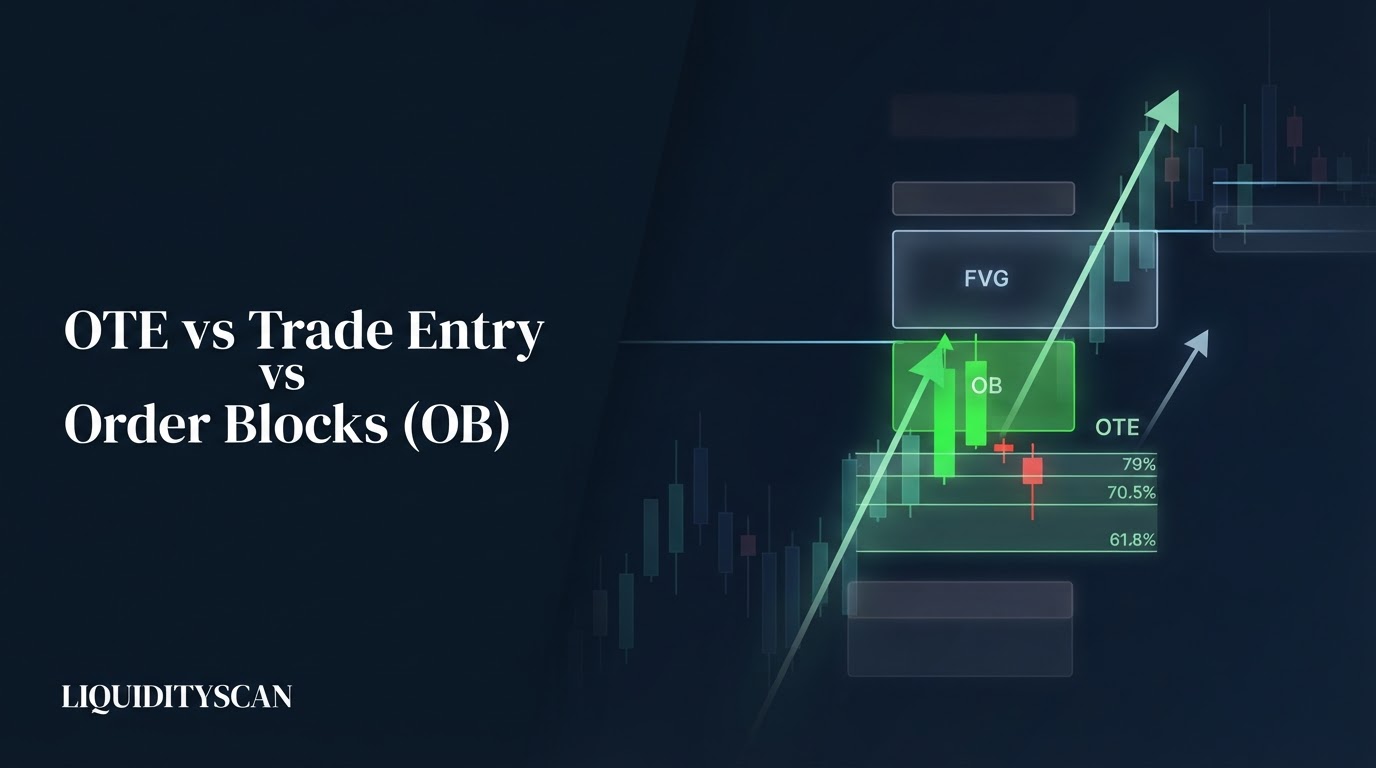
OTE vs Order Block: Which Entry Gives the Better Fill?
OTE and the order block answer the same question — where do I join the leg? — from opposite directions. OTE is a fib-defined retracement band; the order block is a candle zone left by displacement. Here is how their fills, stops, and R:R actually compare.
Hayk Muradian·
·11 min
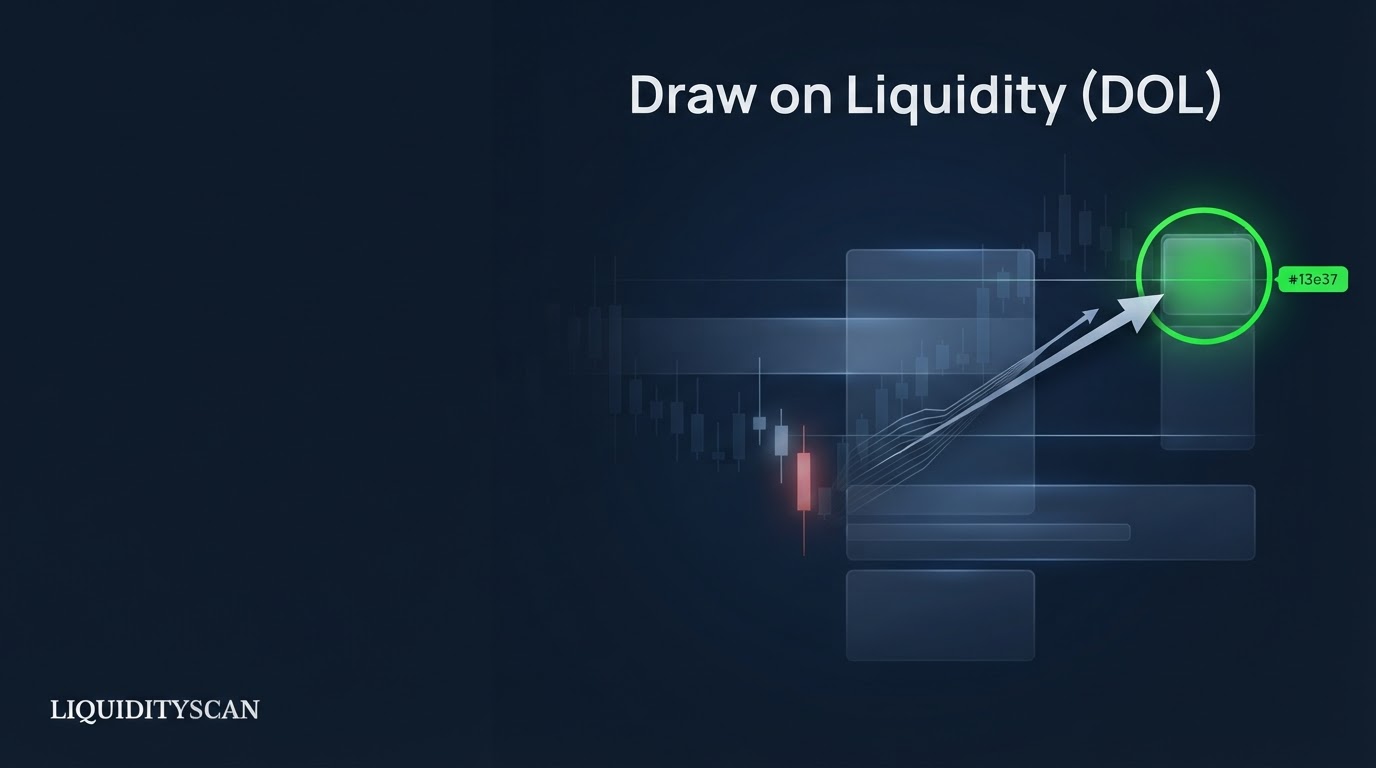
Draw on Liquidity (DOL): How to Predict the Next Target
The draw on liquidity (DOL) is the liquidity pool or inefficiency price is actively being delivered toward — the market's current magnet. Name it correctly and every expansion, sweep, and reversal starts making sense; name it wrong and no entry model can save the trade.
Hayk Muradian·
·11 min
Meet the LiquidityScan AI Agent: Ask for Setups in Plain English
Sometimes you do not want to click through ten surfaces, you just want to ask "what BTC setups are live in the NY session?" The LiquidityScan AI Agent is a tool-using assistant that answers that question from live platform data, never from a guess.
Hayk Muradian·
·10 min
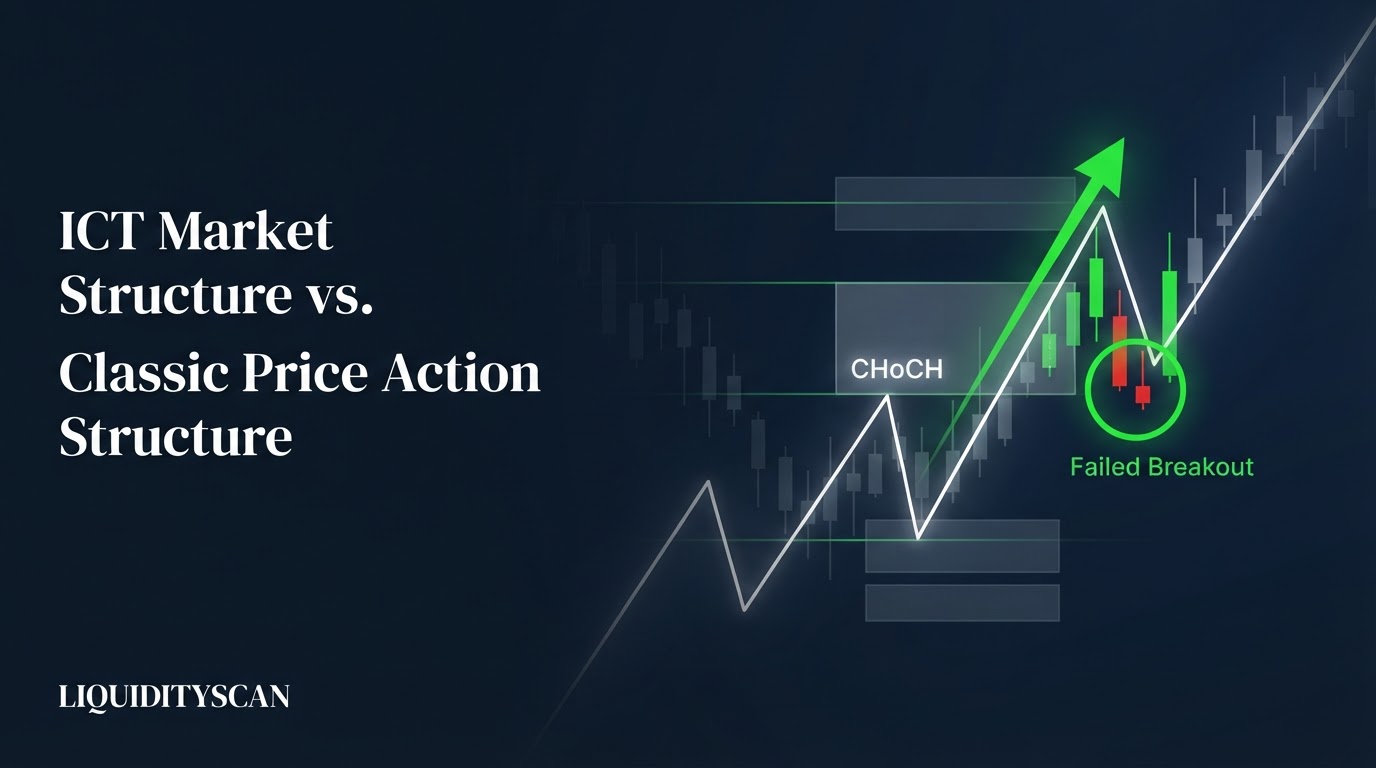
ICT Market Structure vs Classic Price Action Structure: What Changed?
ICT kept Dow theory's skeleton — higher highs and higher lows still define trend — but changed why structure breaks, what confirms one, and when it matters. The failed breakout a classic trader avoids is a completed liquidity sweep an ICT trader trades the other way.
Hayk Muradian·
·13 min

The X-Ray Analyzer: A Full Per-Coin ICT Dossier in One Click
X-ray coin analysis means typing one symbol and getting a single live dossier that aggregates everything the platform already knows about that coin — price stats, multi-timeframe charts, a bias verdict, and every active scanner signal — instead of opening ten tabs.
Hayk Muradian·
·10 min
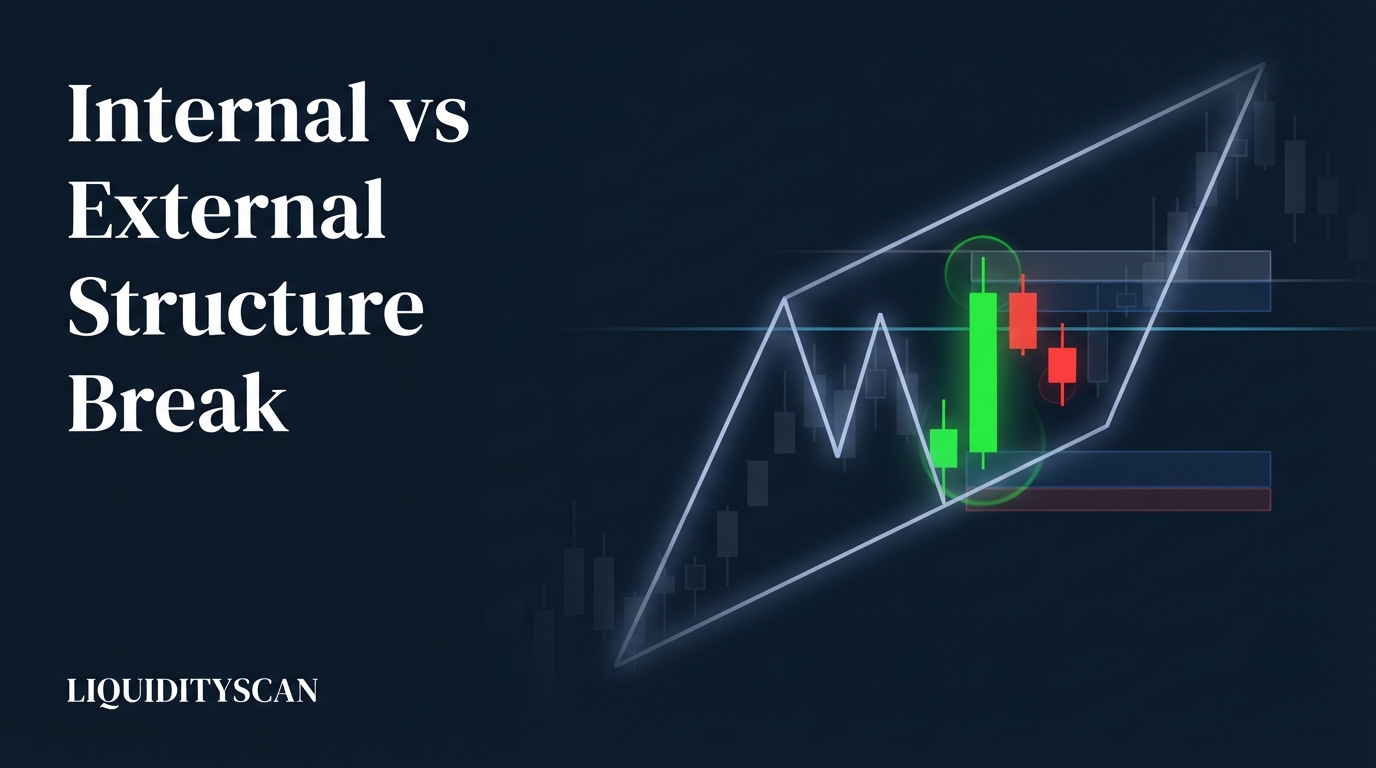
Internal vs External Structure Break: Which One Should You Trade?
External structure is the swings that define your dealing range; internal structure is everything printed inside it. Trade internal breaks as entries in the direction of external structure — and treat internal breaks against it as inducement until the range extreme actually gives way.
Hayk Muradian·
·11 min
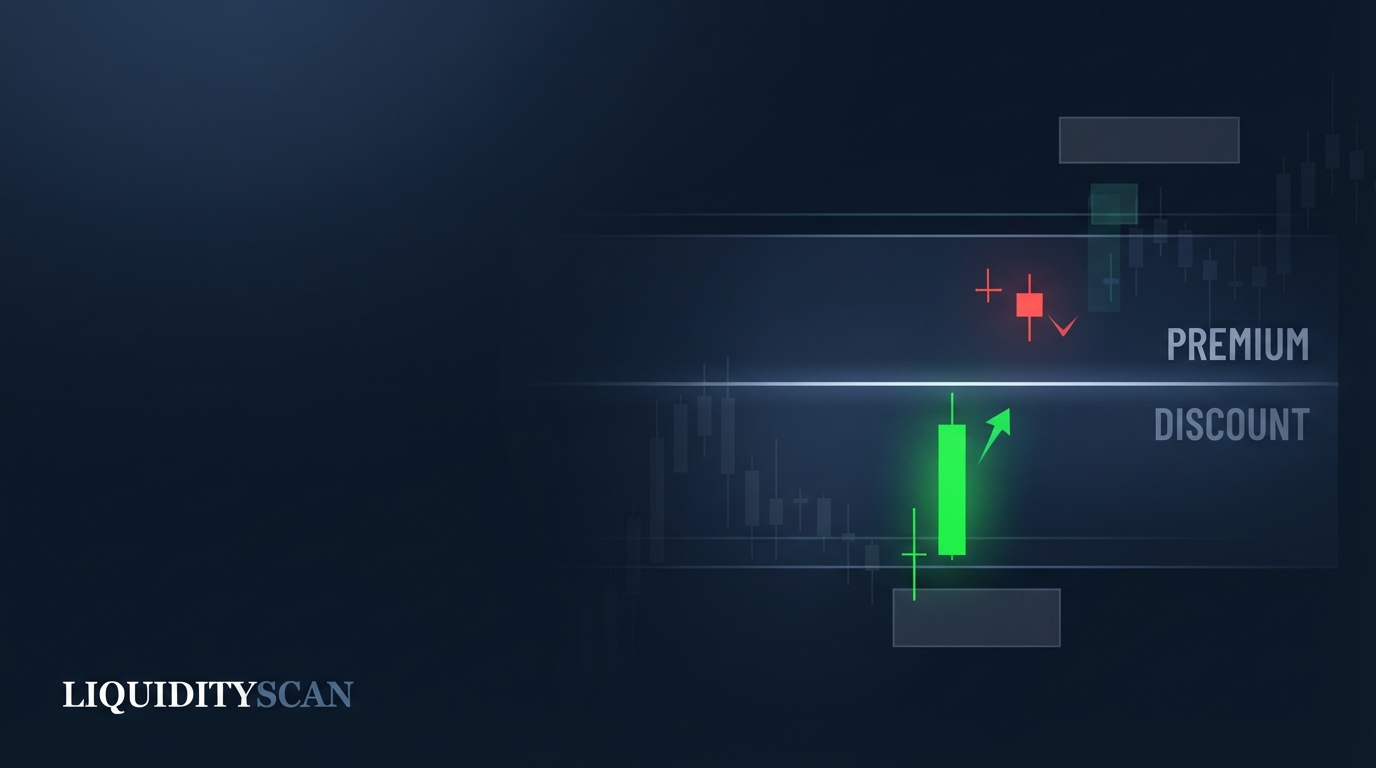
Equilibrium in ICT: The 50% Level That Splits Premium From Discount
Equilibrium in ICT is the 50% level of the current dealing range — the fair-value midpoint that separates premium from discount. Institutions accumulate longs below it and distribute above it, which makes equilibrium the single most important filter in the ICT model.
Hayk Muradian·
·11 min

The ICT Scanners Inside LiquidityScan, Explained
LiquidityScan runs over a dozen ICT/Smart-Money detection engines on closed candles. Here is the full scanners list: what each one finds, its timeframes and grades, and honestly which ones give entries versus which just surface zones and context.
Hayk Muradian·
·11 min
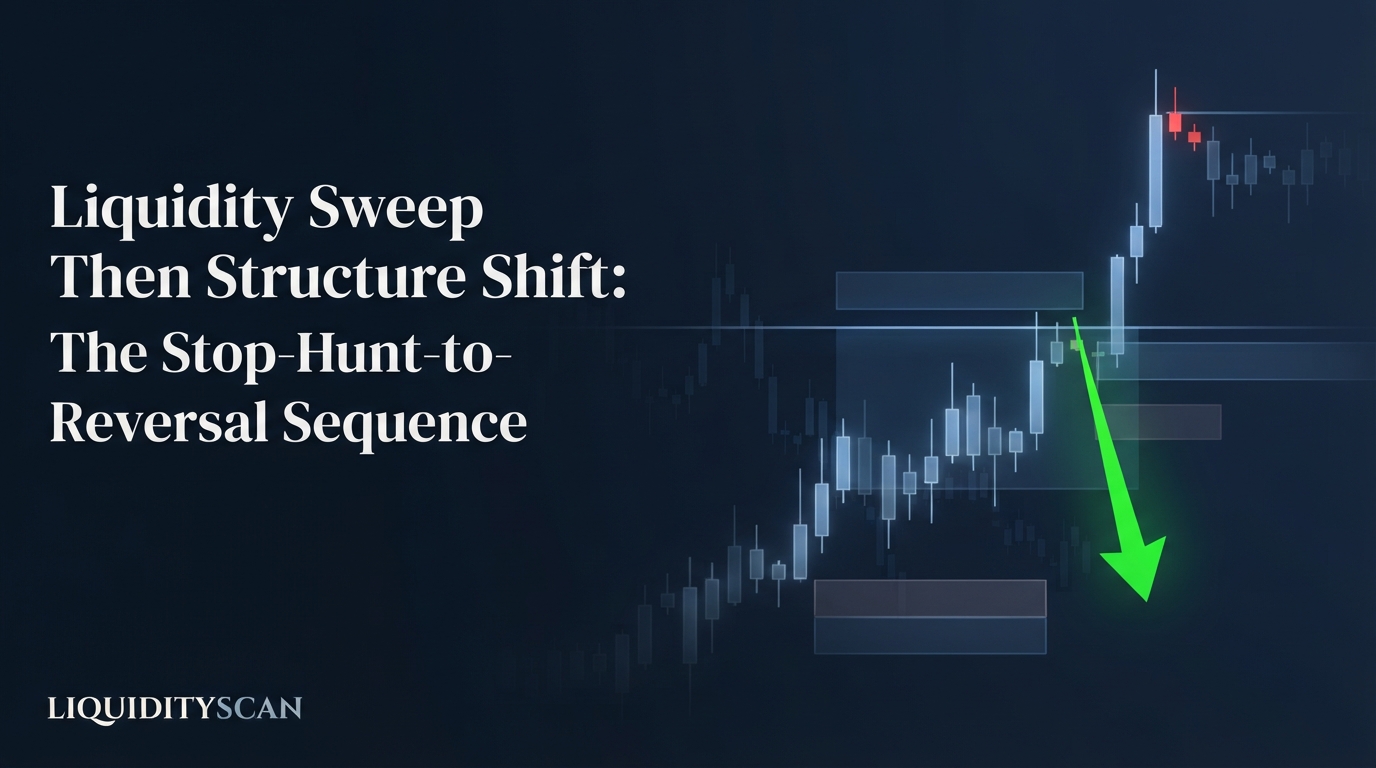
Liquidity Sweep Then Structure Shift: The Stop-Hunt-to-Reversal Sequence
A liquidity sweep alone is a suspicion; a sweep followed by a market structure shift is a confirmation. Here is ICT's highest-probability reversal signature broken down step by step — the level, the sweep, the displacement, the MSS — with entries, stops, targets, and the R math.
Hayk Muradian·
·11 min
How to Learn ICT Trading: A Foundations-First Roadmap
ICT's material is a web of interlocking concepts, not a course with a syllabus. This roadmap imposes the missing sequence: five ordered phases, time expectations for each, what to skip early, and how to know when you have actually learned something versus merely watched it.
Hayk Muradian·
·12 min
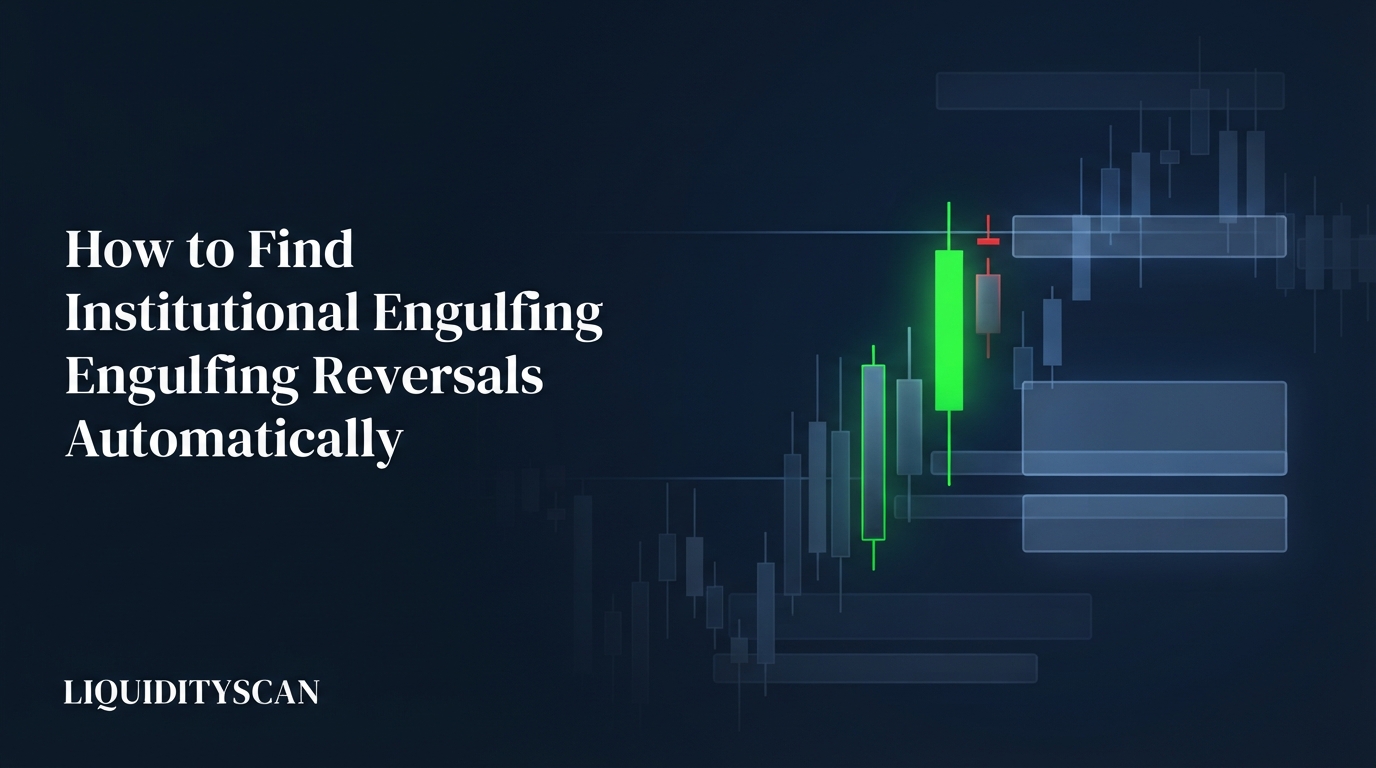
How to Find Institutional Engulfing Reversals Automatically
An engulfing scanner watches every pair and closed candle for a momentum bar that engulfs the prior one, then grades it as continuation or reversal so you skip the noise and judge context instead of hunting charts.
Hayk Muradian·
·10 min
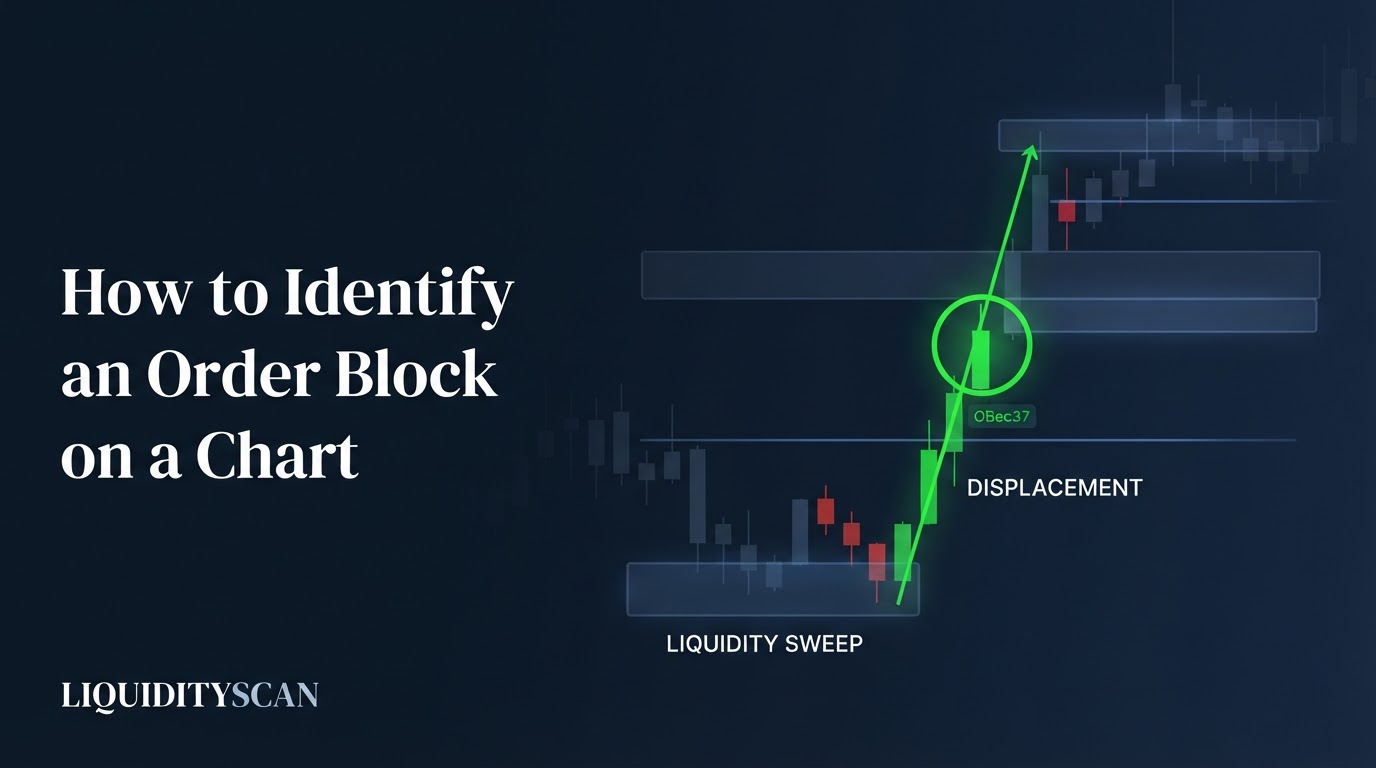
How to Identify an Order Block on a Chart
Identifying an order block starts with the displacement leg and works backward: confirm the liquidity sweep at the origin, isolate the last opposite candle, check the structural consequence, then mark the zone open-to-extreme with a mean threshold. Here is the exact five-step routine.
Hayk Muradian·
·11 min
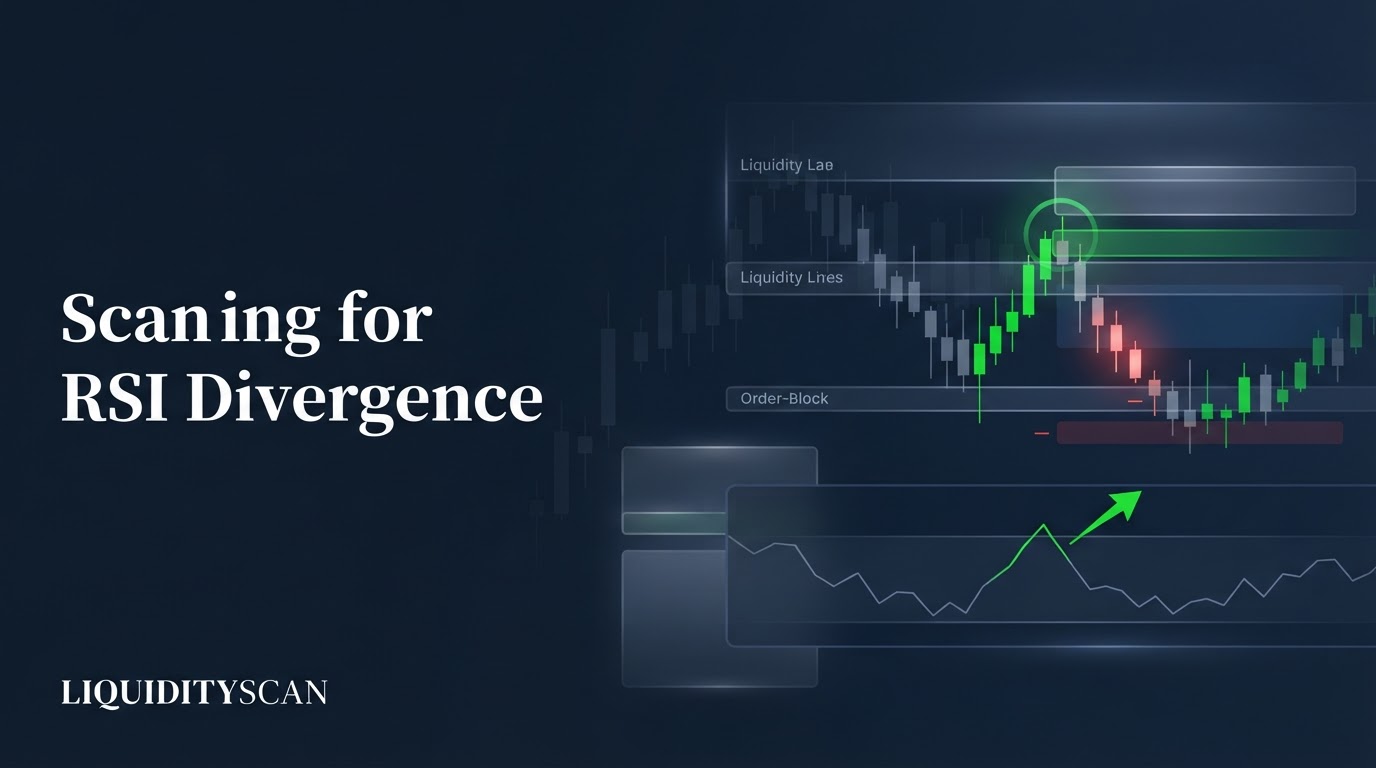
How to Spot RSI Divergence Across Hundreds of Pairs
You cannot eyeball RSI on 400 charts. An RSI divergence scanner flags every price-vs-momentum divergence at an extreme automatically, then you bring the structure read. Here is how the detection works and why RSI is best as a confluence filter.
Hayk Muradian·
·11 min
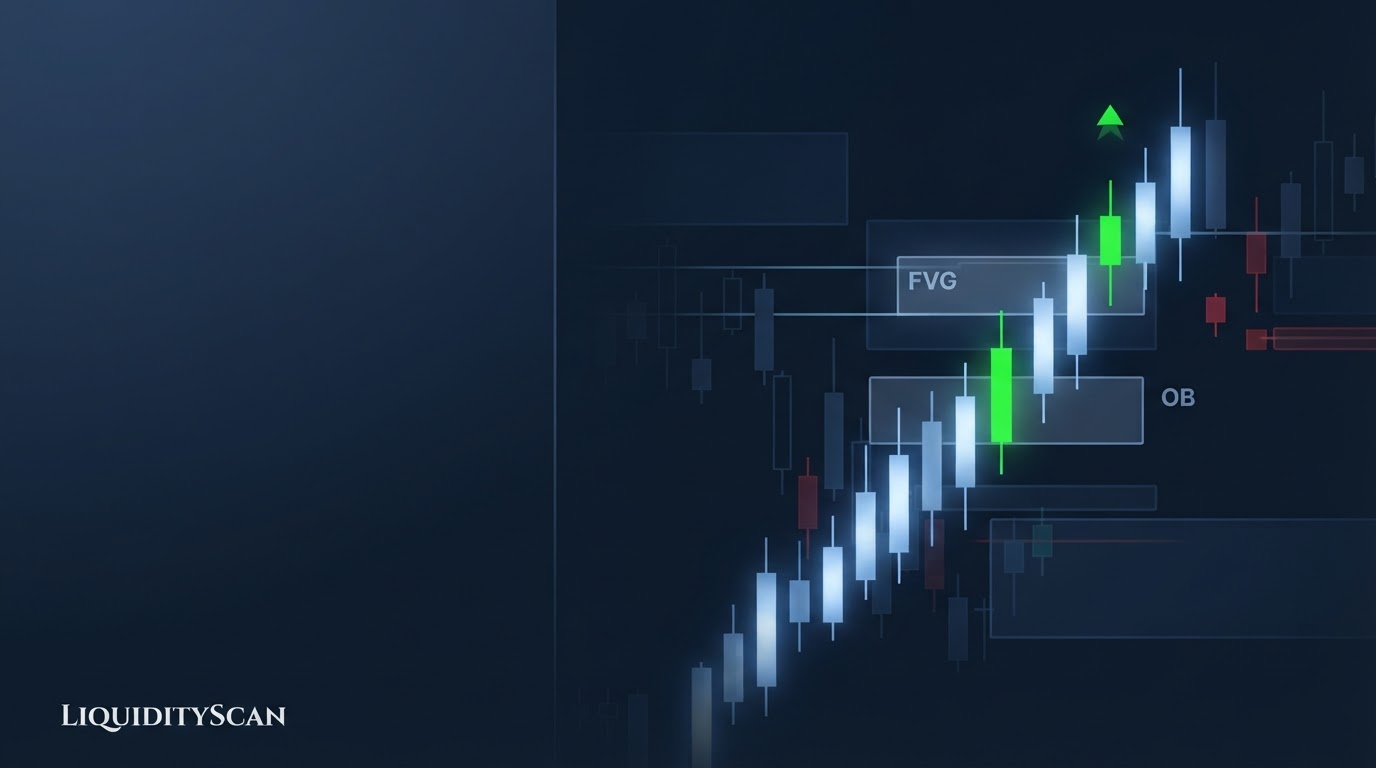
What Is Institutional Order Flow and How Does Structure Reveal It?
Institutional order flow is the aggregate directional intent of large participants, and ICT traders read it from price structure itself: displacement legs, unmitigated order blocks and FVGs, and the swing sequence. Structure records what size already did, and that record becomes your bias.
Hayk Muradian·
·12 min
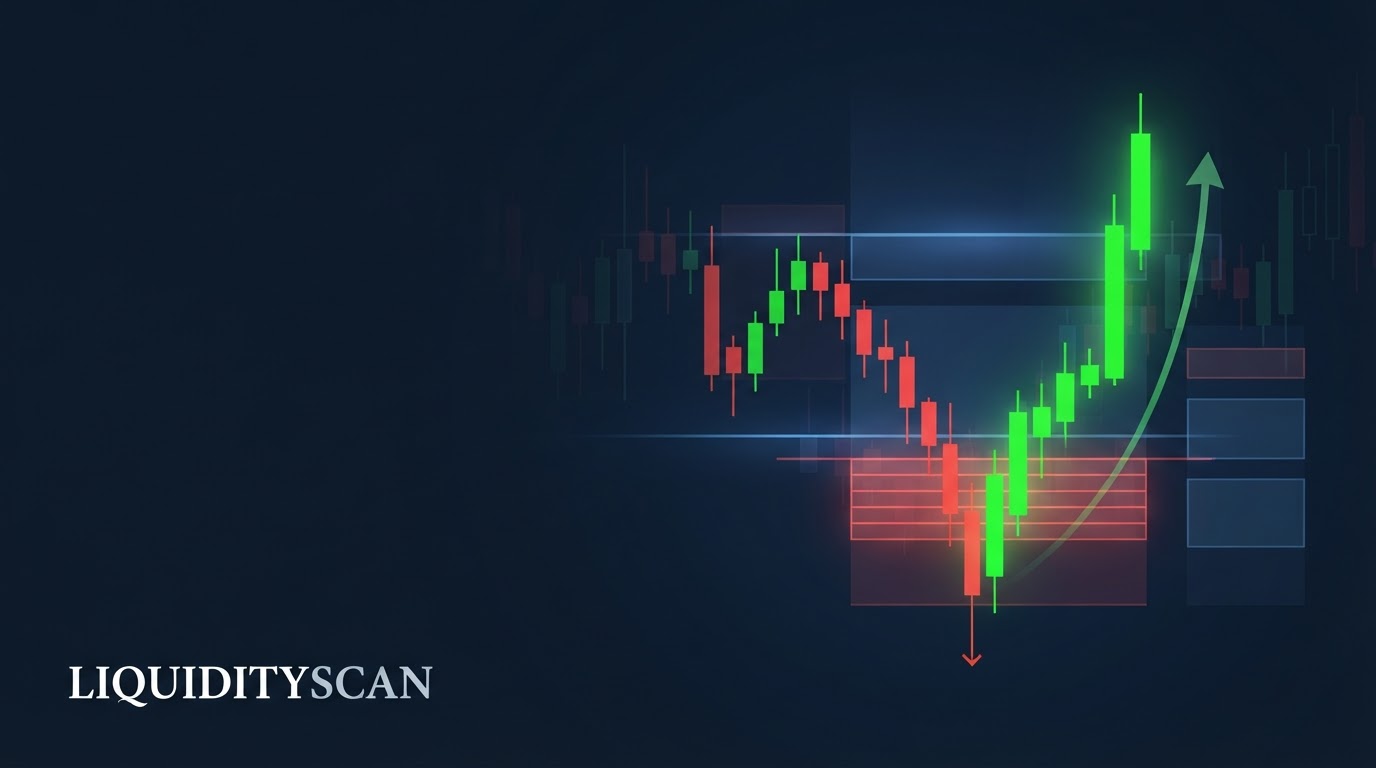
Why Does Price Reverse After a Liquidity Sweep?
Price reverses after a liquidity sweep because the triggered stops are the trade: resting stop orders become market orders, handing institutions the only pool of counterparty volume deep enough to fill size. Once that pool is absorbed, the pressure that drove price there is gone.
Hayk Muradian·
·11 min
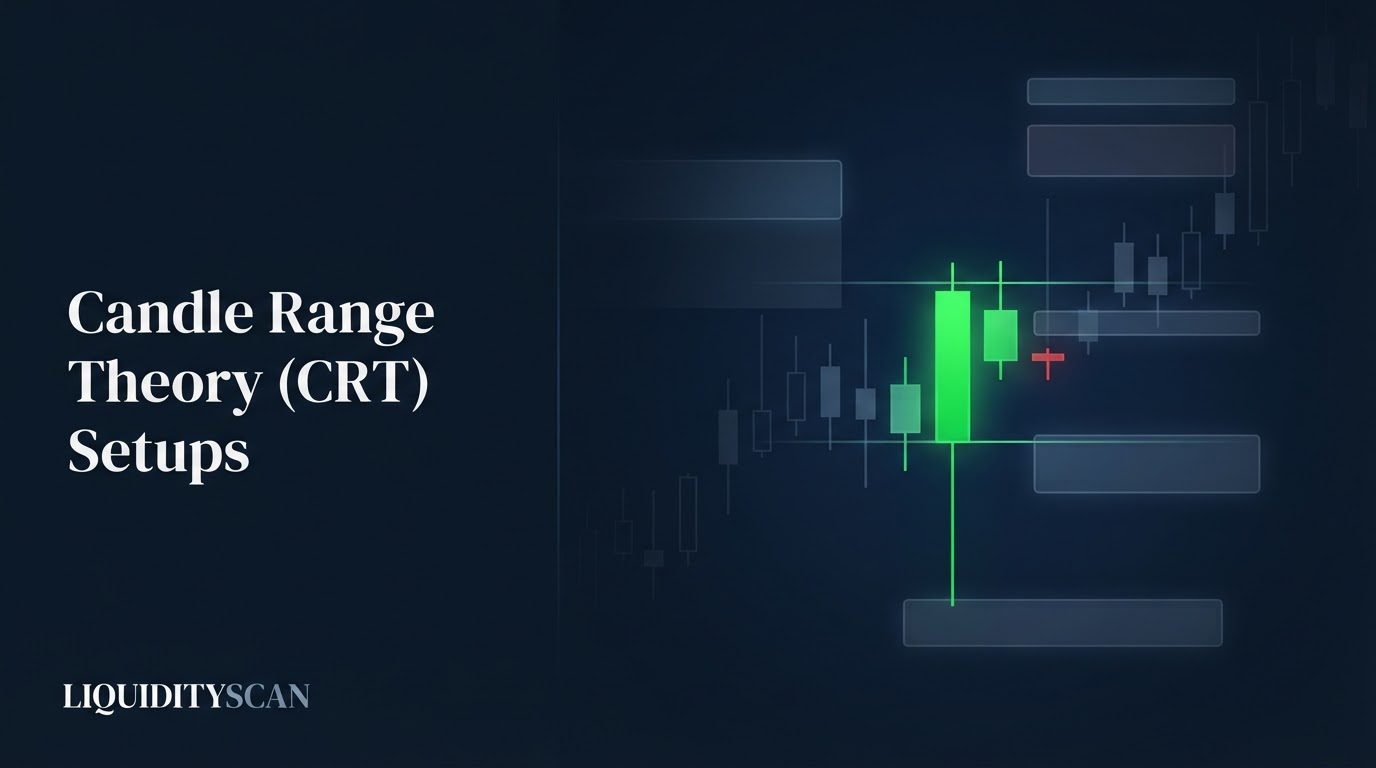
How to Find CRT (Candle Range Theory) Setups Every Day
A CRT scanner watches every pair and timeframe for the same thing you hunt by hand: a candle that wicks past the prior range to grab liquidity, then closes its body back inside. Here is how to surface those setups every day.
Hayk Muradian·
·10 min
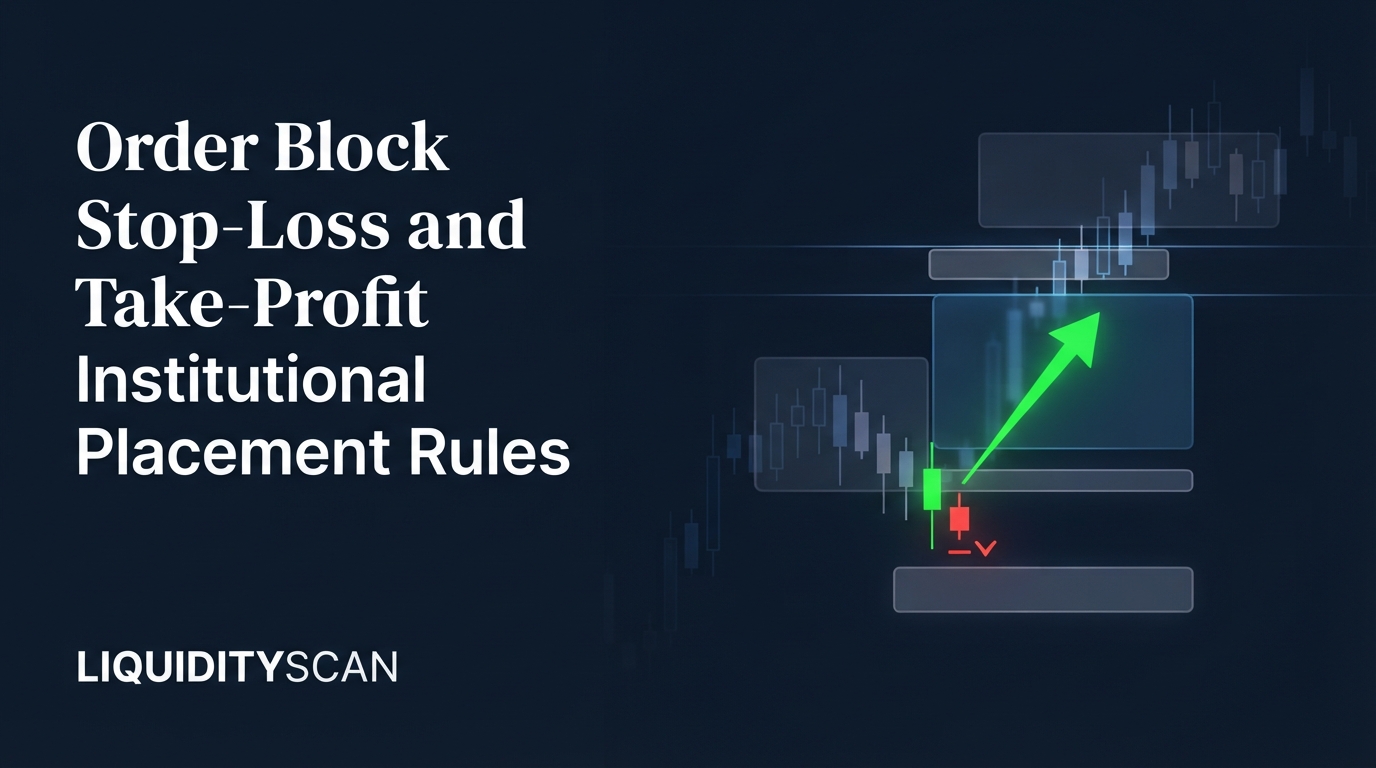
Order Block Stop-Loss and Take-Profit: Institutional Placement Rules
Place an order block stop loss beyond the block's invalidation — the extreme wick, the mean threshold, or the sweep low that formed it — never inside the zone, and take profit at opposing liquidity pools. Here are the exact placement rules, buffer sizing, and the R:R math.
Hayk Muradian·
·12 min
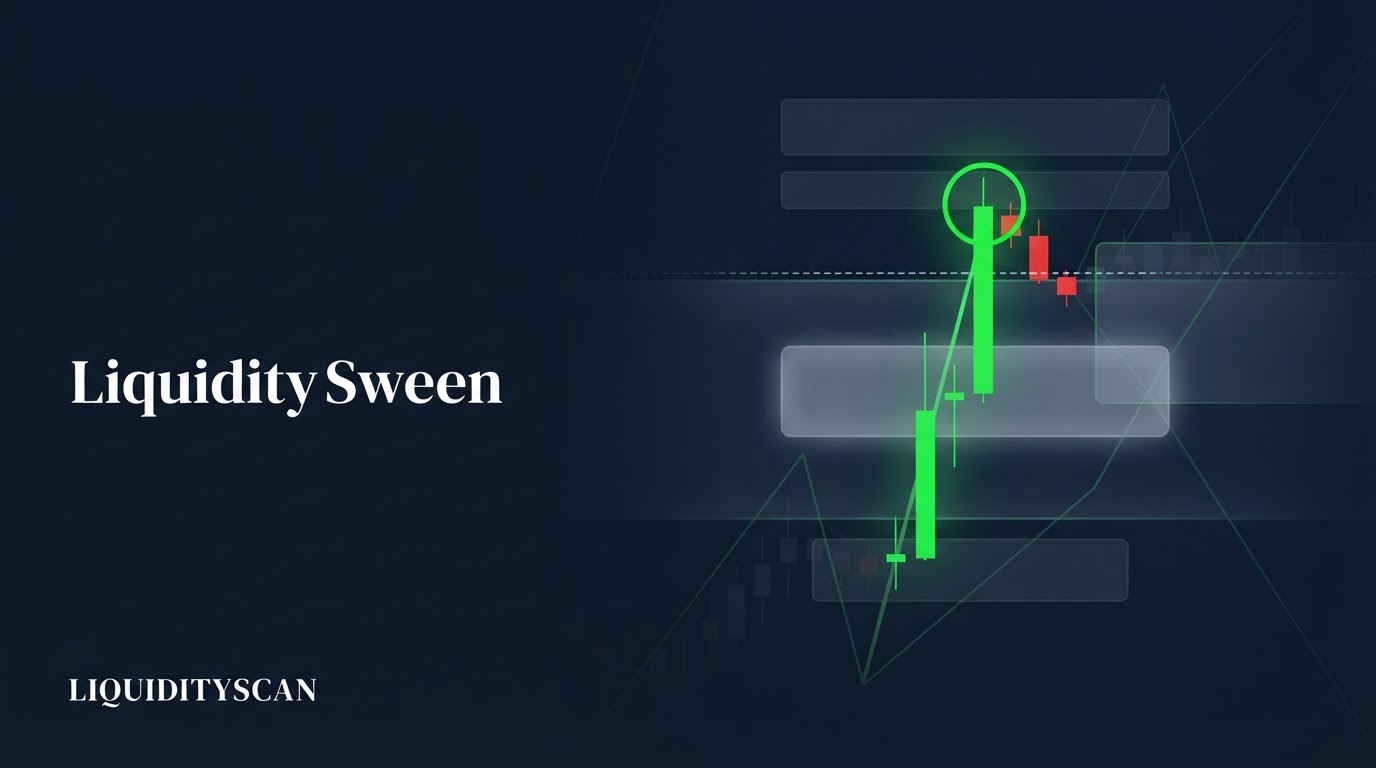
Liquidity Sweep vs Liquidity Grab: Is There a Difference?
Liquidity sweep and liquidity grab almost always describe the same event: price wicks through a stop cluster and reverses. The useful convention — sweep is the chart pattern (wick through, close back inside), grab is the institutional act of collecting those orders.
Hayk Muradian·
·13 min
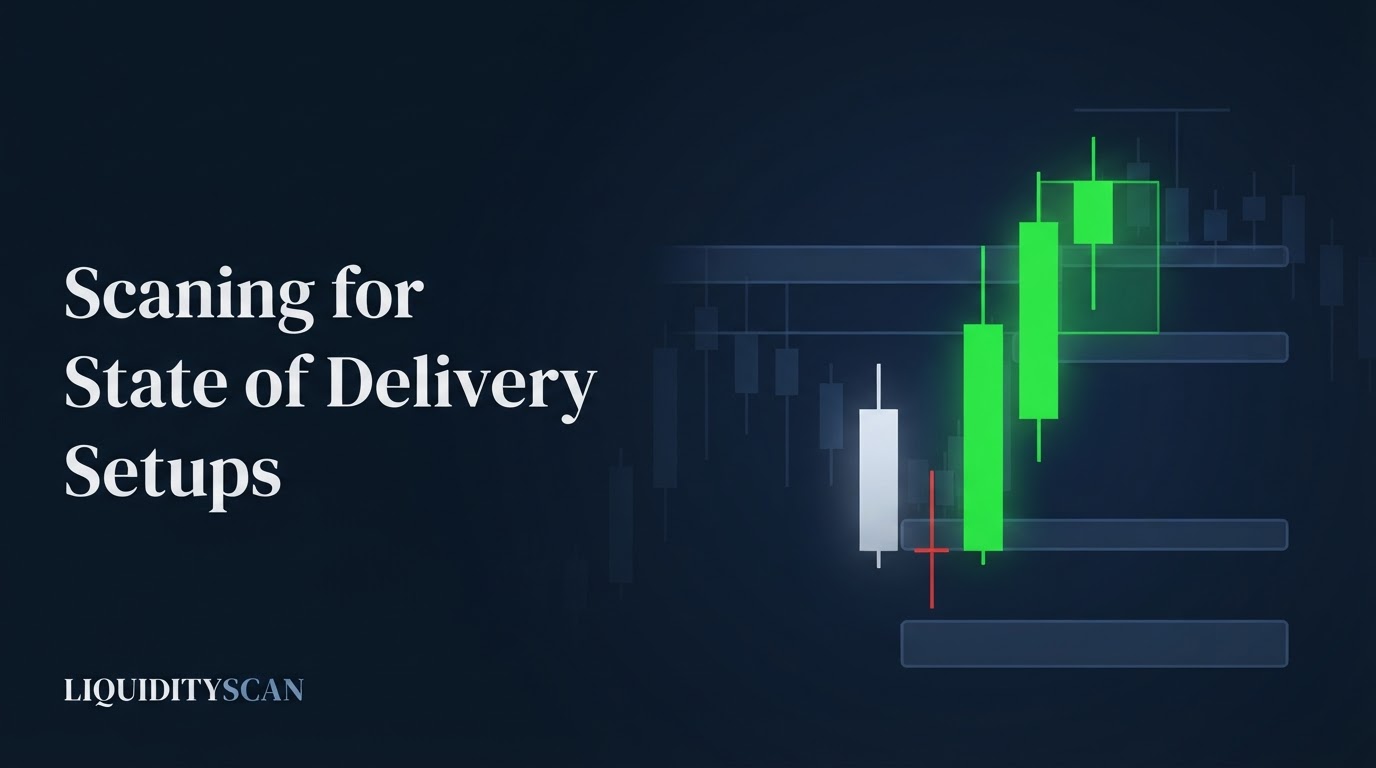
How to Scan for CISD (Change in State of Delivery) Setups
A CISD scanner watches every pair and timeframe for the exact reverse-candle, body-break, and fair-value-gap sequence that confirms a change in state of delivery — then flags the structure and its proximity zone so you don't have to eyeball dozens of charts.
Hayk Muradian·
·10 min
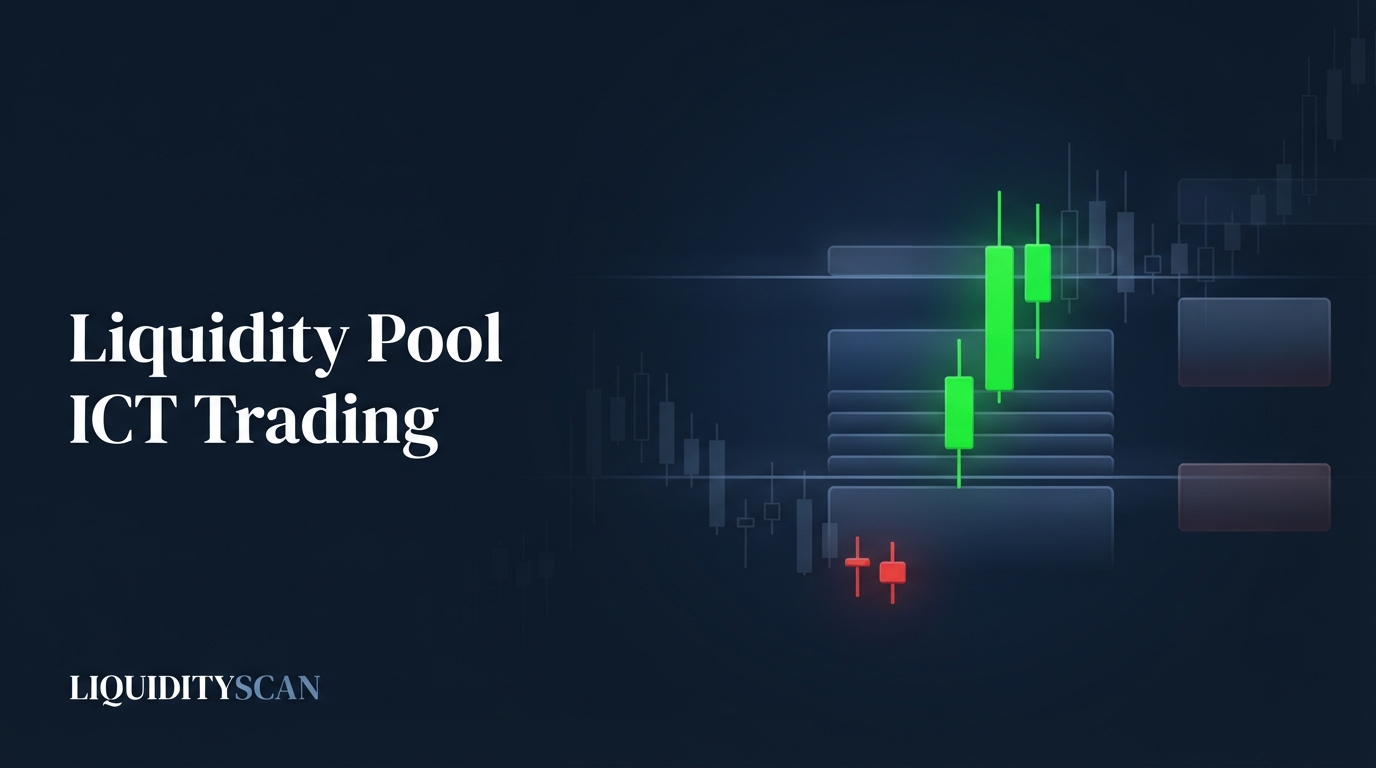
What Is a Liquidity Pool in ICT Trading?
A liquidity pool in ICT trading is a concentration of resting orders — protective stops, breakout entries, and pending limits — stacked at an obvious price level. Institutions drive price into these pools to fill size, which is why the most obvious highs and lows get run first.
Hayk Muradian·
·12 min
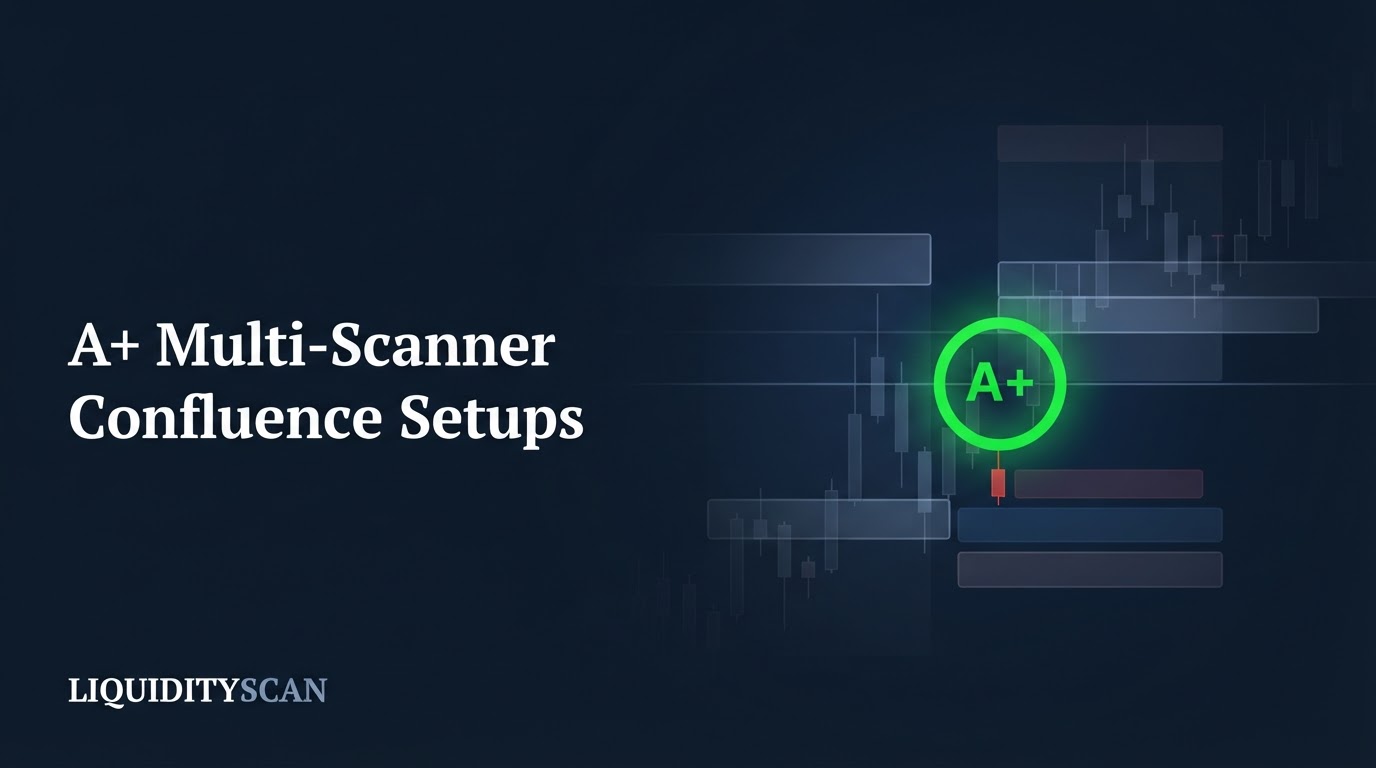
How to Find A+ Multi-Scanner Confluence Setups
A confluence scanner filters the market down to setups where independent engines and timeframes agree on a single direction. Here is how to find A+ multi-scanner confluence without cross-referencing charts by hand.
Hayk Muradian·
·10 min
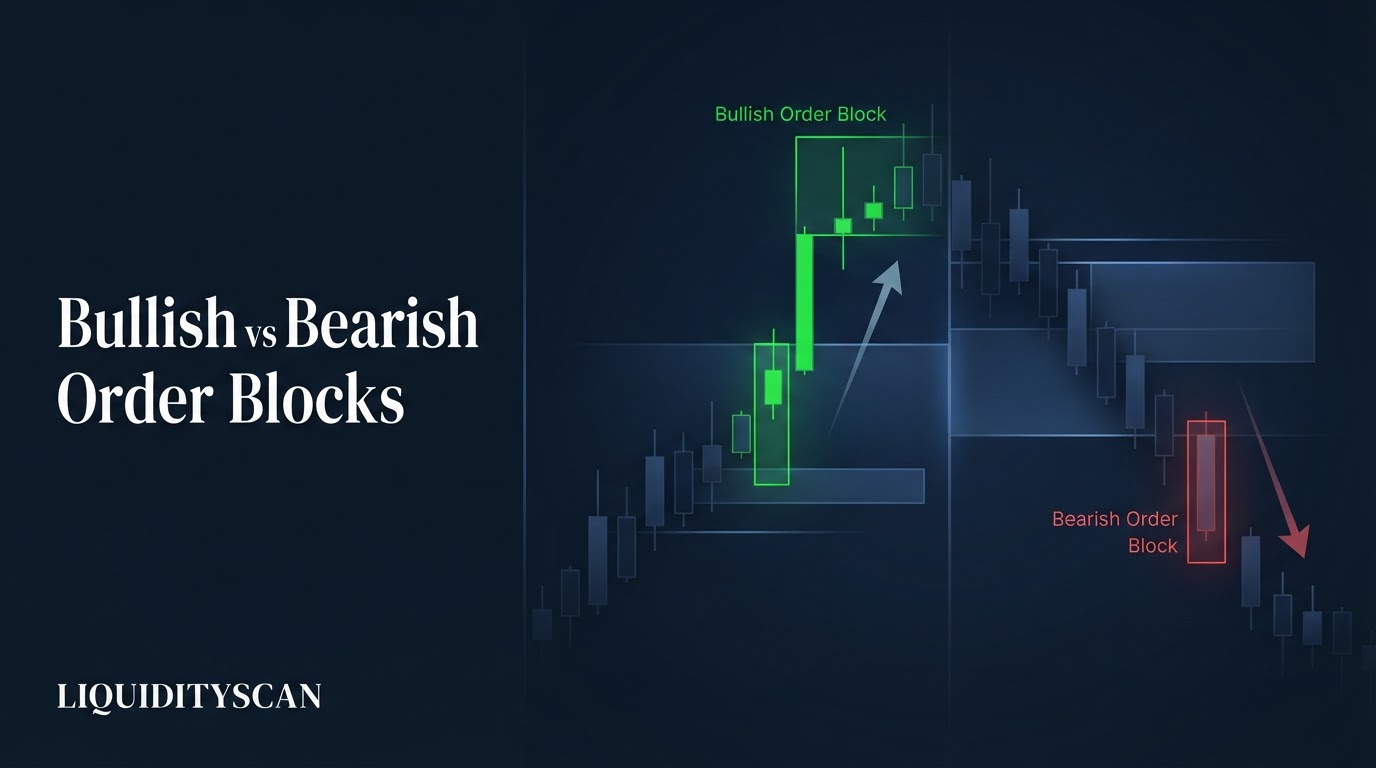
Bullish vs Bearish Order Block: How to Identify and Mark Each
A bullish order block is the last bearish candle before a displacement leg up; a bearish order block is the last bullish candle before a displacement leg down. This guide shows exactly how to identify, mark, and filter each — plus the invalidation rule that kills a zone for good.
Hayk Muradian·
·11 min
Not trading advice. LiquidityScan publishes educational content for informational purposes only. Trading involves substantial risk of loss.