
What Is Fractal Market Structure?
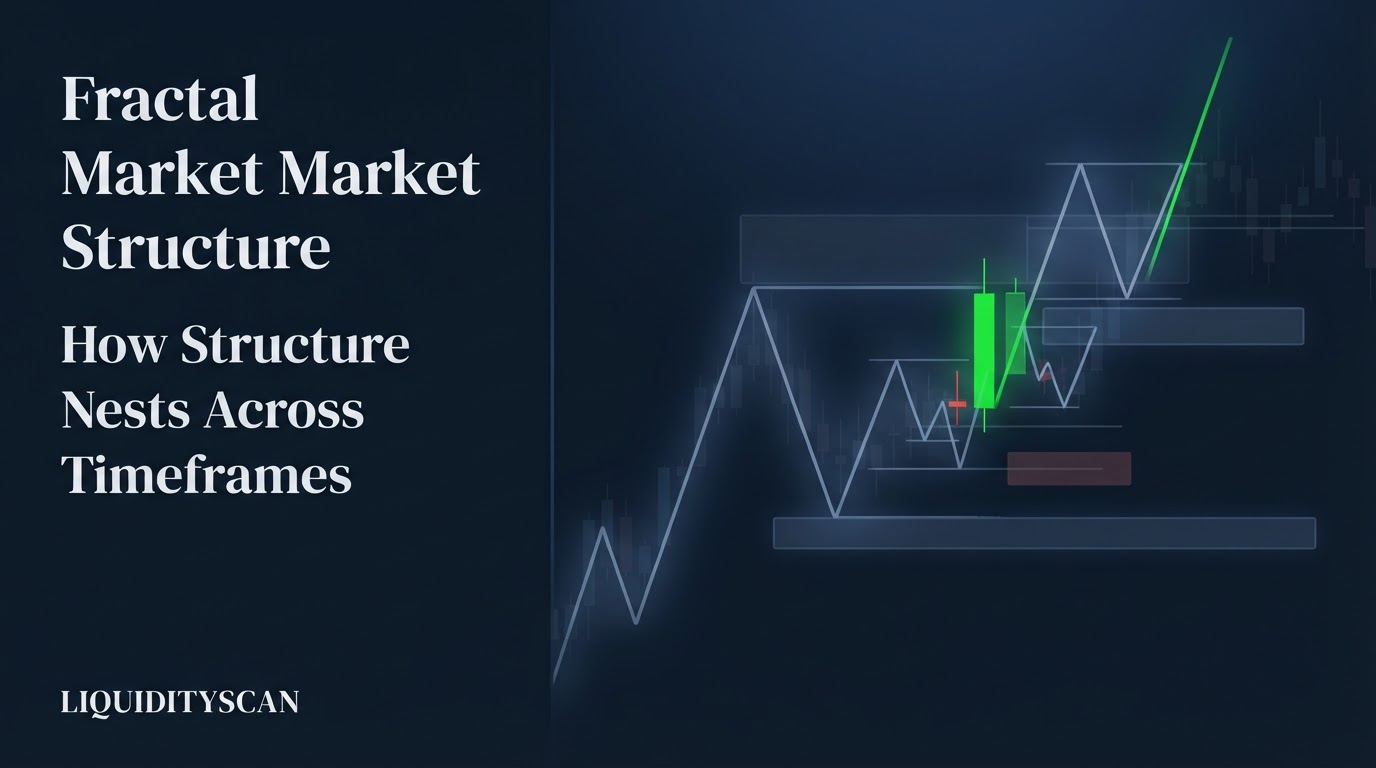
Fractal market structure means the same structural geometry — swing highs, swing lows, breaks of structure, pullbacks — repeats at every timeframe. A single 4H trend leg decomposes into complete 15-minute trends, and those into complete 1-minute trends, under identical rules at each level.
The idea traces to Benoit Mandelbrot's observation that price series look statistically similar at different scales: strip the axis labels from a weekly chart and a 5-minute chart and most traders cannot tell them apart. ICT operationalizes that observation. The rules for marking swings, Break of Structure (BOS), and Change of Character (CHoCH) do not change between the monthly and the 1-minute; only the scale does.
Practically, this means nothing on your chart exists in isolation. Every 4H leg is built from complete 15m trends — full sequences of impulse, pullback, and continuation, each with its own swing points and structure breaks. Zoom in on any structural element and you find the whole pattern again, one level down. That nesting is not a curiosity; it is the load-bearing assumption behind all multi-timeframe ICT analysis.
Why Order Flow Is Self-Similar: The Mechanism
Self-similarity is not a mystical property of charts; it falls out of how large orders are executed. An institution that needs to buy a nine-figure position cannot lift the offer once. The parent order is sliced into child orders and worked over hours or days by execution algorithms — a process documented in the Bank for International Settlements' research on execution algorithms and market functioning.
Each child order behaves like a miniature version of the parent campaign: it seeks liquidity, pushes price, pauses, and lets price retrace before the next slice works. The parent order creates the daily trend leg; its children create the 15m legs inside it; the individual fills create the 1m rotations inside those. Accumulation and delivery cycles nest because the orders themselves nest.
Liquidity engineering repeats at every scale for the same reason. Stops cluster below swing lows whether the swing formed over three weekly candles or three 1-minute candles, so the sweep-and-reverse pattern — the raid on buy-side and sell-side liquidity — prints at every resolution. The IPDA framing in ICT amounts to exactly this: price is delivered from liquidity pool to liquidity pool at every scale simultaneously.
The Three Mapping Rules of Fractal Market Structure
Rule 1: One HTF Candle Is a Full LTF Price Journey
A 4H candle is not a unit of price action; it is a summary statistic of sixteen 15-minute candles. Open, high, low, and close compress an entire LTF journey into four numbers. A bullish 4H candle with a long lower wick almost always decomposes into a 15m downtrend, a reversal at the wick low, and a 15m uptrend into the close.
This is why HTF and LTF charts appear to contradict each other. Neither lies — they report the same order flow at different compression ratios. Train yourself to read a large 4H wick as a completed 15m trend-and-reversal sequence, not as a vague "rejection."
Rule 2: HTF Swing Points Are LTF Structure Clusters
A 4H swing low looks like a single point. On the 15m it is a neighborhood: typically a sweep of a prior 15m low, a displacement candle, a market structure shift, and the origin of a new 15m trend — often spread across 60–90 minutes and half a percent of price. Treat HTF swing points as zones of dense LTF structure, never as lines.
This also explains a stop-placement asymmetry: stops set a sensible buffer below the 4H swing low often survive, because that point is defended by an entire LTF accumulation cluster, while tight stops inside the cluster get consumed by its normal rotations.
Rule 3: Internal Structure on the HTF Is External Structure on the LTF
Call this altitude equivalence. The pullback lows inside a 4H leg are internal range liquidity from the 4H perspective — but each one is an external swing low on the 15m, with its own BOS history and its own resting stops. Conversely, a 15m BOS is, from the 4H seat, just a tick inside a pullback.
The same event holds a different structural rank depending on your altitude. Most multi-timeframe confusion is two traders describing the same event from different altitudes and believing they disagree.
How ICT Exploits Fractality: Top-Down to Entry
The ICT methodology is, at its core, an exploitation of fractal market structure. Top-down analysis works because the higher timeframe defines which lower-timeframe structures matter: the weekly and daily supply the narrative — the Draw on Liquidity and the PD arrays price should respect — while the 4H down to the 5m supply timing and precision.
Without fractality, an HTF bias could not be executed on an LTF chart at all; the structures would be unrelated.
The Story of the Candle
When price reaches a key HTF array, drop timeframes and watch how the current HTF candle is being delivered in real time.
If the daily candle should close bullish off a daily Order Block, the story inside it should read: a 15m sell-off into the array, a sweep of a local low, displacement upward, and a 15m structure shift. You are watching the daily candle's lower wick being manufactured live.
If instead the 15m keeps printing lower highs and clean bearish BOS straight through the array, the daily story is wrong — and you know it hours before the daily candle closes. Fractality converts HTF patience into LTF evidence.
The Fractal Entry Refinement Chain
The classic ICT sequence chains one confirmation per altitude:
- Weekly: price trades into a weekly Fair Value Gap (FVG) or order block — the narrative level.
- Daily: inside that array, wait for a daily-visible liquidity sweep — a raid of a prior daily low that closes back inside the range.
- 4H: after the sweep, demand a 4H market structure shift — displacement through the most recent lower high.
- 15m: enter the retrace into the 15m FVG left by that displacement leg.
Each step keeps the target anchored to the HTF objective while collapsing the stop. Suppose the weekly array sits 8% below the weekly draw. Entering blind at the array might require a 2.5% stop — roughly 3R. Waiting for the daily sweep plus 4H shift trims the stop toward 1% — about 8R.
Entering the 15m FVG with a stop below the swept low can cut it to 0.3% — north of 20R on the same idea. The honest cost: every refinement adds a condition that may never print, so frequency falls as precision rises. Fractality lets you choose where on that curve you operate.
The Limits of Fractal Market Structure
Self-similarity has a floor. On sub-minute charts, spread, tick size, queue dynamics, and latency competition dominate; the "structure" you see at 15 seconds is mostly market-microstructure mechanics, not order-flow campaigns. For liquid crypto and FX pairs the practical floor is around the 1-minute chart — below it, the geometry persists but the meaning does not.
Time is not fractal even when price is. A 15m structure built during the New York kill zone carries institutional participation; the same geometry printed at 22:00 UTC on thin books is a different animal wearing the same shape. Session opens and closes, and high-impact news, inject discontinuities — structure that forms across a session boundary should be heavily discounted.
And when nested structures conflict, the higher timeframe wins by capital weight. A 15m uptrend inside a 4H bearish delivery is usually the pullback that gets sold into. LTF structure is tactics inside HTF strategy, never the reverse.
Worked Example: One 4H Leg Through Its 15m Internals
BTCUSDT prints a bullish 4H leg from a swing low at 96,380 to a swing high at 103,800 over roughly five 4H candles. Decompose it:
- Candle 1 — the reversal candle (closes 98,100, lower wick to 96,380). On the 15m: a downtrend into the level, the prior 15m swing low at 96,550 swept to 96,380, then a displacement candle to 97,300 leaving a 15m FVG at 96,700–96,900 and a structure shift on the close above 97,050. That entire 15m story is one 4H wick.
- Candles 2–3 (bodies carry 98,100 to 101,600). On the 15m: a textbook uptrend — three consecutive BOS, shallow pullbacks into 15m FVGs at 98,900 and 100,200. What reads as "momentum" on the 4H is 15m structure compounding.
- Candle 4 — small-bodied (high 102,400, low 100,900). On the 15m: a complete distribution-and-reclaim cycle — CHoCH at 101,900, a downtrend sweeping internal lows to 100,900, then reversal. The 4H calls it consolidation; the 15m ran a full trend down and back.
- Candle 5 — the final 15m uptrend runs the external 4H liquidity above the prior high at 103,750, stalls at 103,800, and prints a 15m CHoCH: the first lower-altitude warning that the 4H leg is complete.
Every 4H feature — wick, body, pause, terminal high — mapped one-to-one onto a complete 15m structure. Nothing happened on the 4H that the 15m did not narrate first.
How to Practice Seeing Fractal Structure — and the Mistakes to Avoid
The drill is decomposition. Pick one completed HTF leg — last week's dominant 4H move on any liquid pair. Scroll the 15m from the leg's origin to its terminus and mark every swing, BOS, and CHoCH. Then annotate which 15m structures produced each 4H candle's body and wicks.
One leg fully decomposed teaches more than a hundred casual chart glances; repeat weekly until the mapping is automatic. LiquidityScan's market structure scanner tracks BOS and CHoCH per timeframe independently, which makes checking nested state live faster than flipping charts by hand.
The recurring mistakes:
- Trading LTF structure against HTF context. A 15m CHoCH inside a 4H bearish delivery is usually the beginning of the pullback you should be selling, not a reversal to buy. Rank the conflict by altitude before acting.
- Infinite-regress paralysis. If every timeframe contains another, you can always find one more confirmation to wait for. Fix your ladder in advance — three timeframes with roughly 4–6× separation (daily/4H/15m, or 4H/1H/5m) — and refuse to consult anything outside it.
- Altitude confusion. Counting a 15m BOS as evidence of HTF intent. It is internal noise one level up; only a break of the HTF's own external swing changes the HTF story.
Fractal market structure is the connective tissue of the entire ICT model: it is the reason an HTF narrative can be executed with LTF precision at all. Learn the three mapping rules, respect the noise floor and session boundaries, and let the higher timeframe arbitrate every conflict — the nesting does the rest.
Frequently Asked Questions
Is price action really fractal, or is that a trading myth?
Statistical self-similarity in price series is well documented — Mandelbrot demonstrated scale-invariant behavior in cotton prices as early as 1963, and the property holds broadly across liquid markets. But statistical self-similarity is not predictability. ICT uses fractality as a mapping framework between timeframes, not as a forecasting law on its own.
What timeframe ratio should I use between higher and lower timeframes?
A separation of roughly 4–6× per step works well: daily to 4H to 15m, or 4H to 1H to 5m. Closer ratios (like 1H to 30m) show nearly the same structure twice and add no information; wider ratios (daily straight to 1m) skip so many nesting levels that the mapping becomes ambiguous.
Are ICT fractals the same as the Williams Fractal indicator?
No. The Williams Fractal is a five-bar swing marker — a mechanical way to flag local highs and lows on one chart. Fractal market structure is the concept that entire structural hierarchies nest across timeframes. The indicator can help mark swing points, but it says nothing about how those swings relate between timeframes.
Can I trade 15-minute setups against the daily bias?
You can, but expectancy suffers. Counter-HTF setups fight the dominant delivery, so targets get truncated when the higher timeframe resumes — a 15m uptrend inside a daily downtrend usually terminates at the first meaningful HTF supply. Most traders do better standing aside or waiting for the LTF to realign with the daily draw.
Related query paths
Fractal analysis assumes you can already read structure on a single timeframe. These guides build the ladder from base definitions to full multi-timeframe execution.
- What Is Market Structure in ICT? — the single-timeframe foundation every nesting rule builds on.
- What Is a Swing High and Swing Low in ICT? The 3-Candle Rule — the atomic unit that repeats at every scale.
- BOS vs. CHoCH: The Definitive Guide for SMC Traders — the two structure breaks you will mark on every altitude.
- Internal vs External Structure Break: Which One Should You Trade? — altitude equivalence, applied to the break itself.
- ICT Top-Down Analysis: Multi-Timeframe Alignment — the full workflow that puts fractality to work.
- Best ICT Timeframes: HTF Bias to LTF Entry Guide — choosing your fixed timeframe ladder.
- What Is a Protected Swing High and Low in ICT? — how it connects to protected swing.