
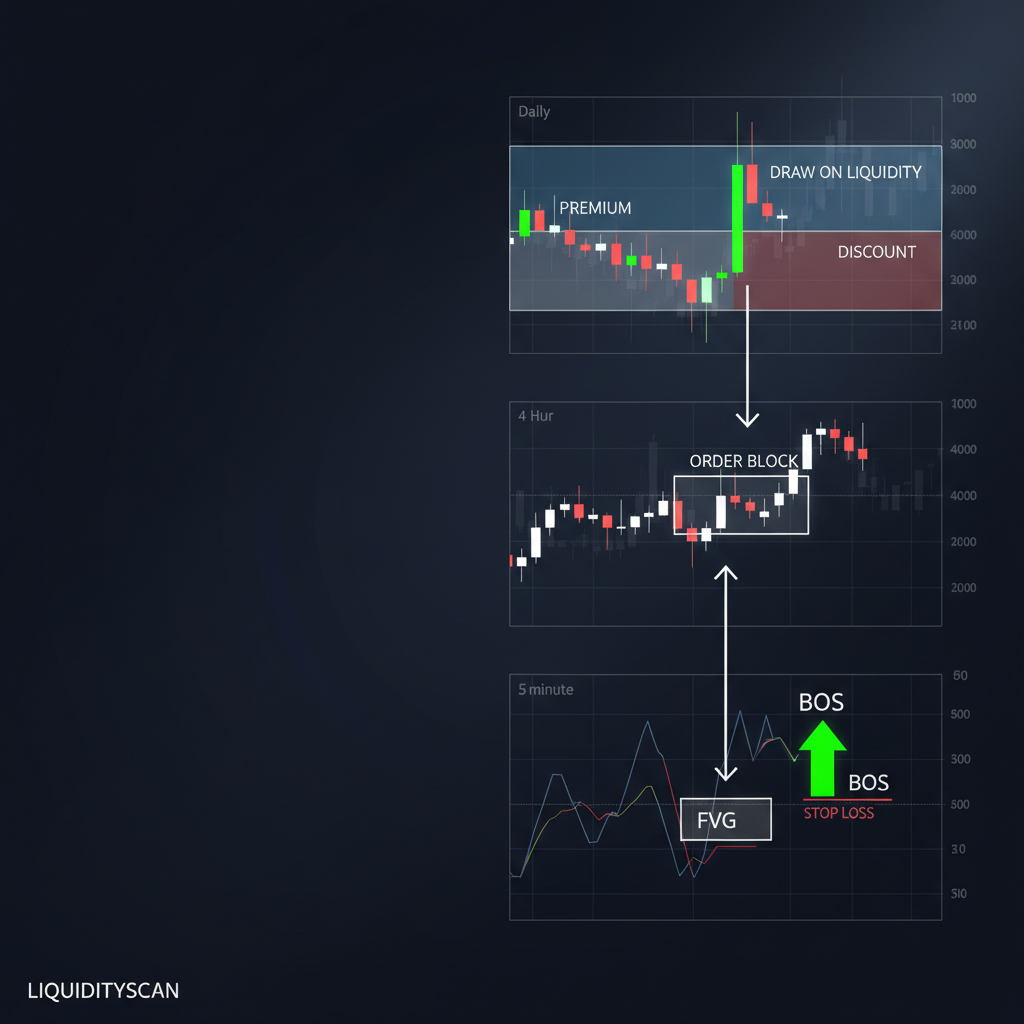
There is no single best ICT timeframe — the method is built on pairing a higher timeframe (HTF) that sets your directional bias and draw on liquidity with a lower timeframe (LTF) that refines the entry. Most traders run a daily or 4H for context and a 15m, 5m, or 1m for execution. The exact pairing depends on how long you intend to hold, not on which timeframe is "best."
Trading one timeframe alone is where the ICT approach quietly breaks. A clean 5-minute order block means little if the daily is drawing price the other way. Time and structure only carry an edge when the frames agree.
Why ICT uses two timeframes, not one
ICT is a top-down method: bias flows down, entries flow up. The HTF answers where price is likely headed and which liquidity pool it's reaching for. The LTF answers when and at what price you engage. Collapse those two jobs onto one chart and you lose either context or precision.
Think of it as a division of labor:
- HTF (daily / 4H): establishes the draw on liquidity, marks premium vs discount within the dealing range, and defines the point of interest you'll trade toward.
- LTF (15m / 5m / 1m): confirms the reaction at that POI — a liquidity sweep, displacement, a fair value gap, and a shift in structure — so your stop stays tight and your risk-to-reward improves.
The HTF keeps you on the right side of the move. The LTF makes the position affordable. Neither replaces the other, and skipping the HTF is the most common reason a technically correct entry still loses.
Timeframe pairings by trader type
Match your pairing to your hold time, not to a chart that looks exciting. A scalper and a swing trader can take the same idea and use completely different frames to express it. Here's how the common profiles line up.
| Trader type | HTF (bias & draw) | Intermediate | LTF (entry) | Typical hold |
|---|---|---|---|---|
| Swing | Weekly / Daily | 4H | 1H / 15m | Days to weeks |
| Intraday | Daily / 4H | 1H | 15m / 5m | Hours, same session |
| Scalp | 4H / 1H | 15m | 5m / 1m | Minutes to an hour |
Notice the pattern: each profile keeps roughly the same ratio between its frames — a bias chart, an optional middle chart to nest structure, and an execution chart. The scalper's HTF is the intraday trader's execution chart, and that's fine. What matters is the relationship, not the absolute numbers.
How the intermediate timeframe earns its place
The middle chart is where a lot of traders find their cleanest read. It nests the HTF point of interest into a more workable structure so your LTF entry isn't floating without reference. On the 4H you see the order block; on the 1H you watch how price approaches it; on the 5m you take the entry once structure shifts. Drop the middle and the jump from daily to 5m often feels like guesswork.
A useful rule of thumb: your entry timeframe should be roughly 4x to 12x faster than your bias timeframe. Daily-to-5m works. Daily-to-1m is usually too wide a gap to hold context.
Why single-timeframe trading fails
Trading one timeframe strips out the context the method depends on. On a lone 5-minute chart, every sweep looks tradable and every FVG looks valid — you have no way to tell which ones align with the larger draw and which are noise inside a retracement. Your win rate becomes a function of luck about which direction the HTF happened to favor.
The failure shows up in three recurring ways:
- Counter-trend entries that look perfect. A textbook LTF setup pointing straight into the HTF draw on liquidity.
- Stops placed by feel. Without HTF structure, you have no logical invalidation level, so stops end up arbitrary.
- Inconsistent results. The same setup wins big one week and bleeds the next because nothing filters for HTF alignment.
Alignment is the filter. When the daily bias, the 4H POI, and the 5m confirmation all point the same way, you're no longer trading a pattern — you're trading a thesis with three layers of agreement behind it.
Choosing your own pairing
Start from your schedule, then work backward to the frames. If you check charts twice a day, a daily-bias, 1H-entry swing pairing fits your life; forcing a 1m scalp around a day job guarantees missed entries and rushed decisions. Pick the slowest execution timeframe your account and patience can tolerate — slower frames mean fewer, cleaner setups and less screen dependence.
Once you settle on a pairing, keep it fixed long enough to gather real data. Rotating timeframes every drawdown makes your results impossible to read. The frames aren't the edge; consistency in how you apply them is.
Frequently Asked Questions
What is the single best timeframe for ICT trading?
There isn't one. ICT is top-down by design, so you always pair a bias timeframe with an entry timeframe. If forced to name a versatile default, a daily-for-bias and 15m-for-entry combination suits most intraday traders.
Can I trade ICT on the 1-minute chart?
Yes, but only as an execution frame beneath a higher bias chart like the 4H or 1H. The 1m alone gives no context for the draw on liquidity, and the gap from daily to 1m is usually too wide to hold structure cleanly.
How many timeframes should I actually watch?
Two at minimum — one for bias, one for entry. Three is common: bias, an intermediate to nest structure, and execution. More than three tends to create conflicting signals rather than clarity.
Related query paths
Once your frames are set, these are the natural next steps to sharpen bias and execution.
- ICT Top-Down Analysis: Multi-Timeframe Alignment — the full method for flowing bias from HTF down to your entry chart.
- Best Timeframe for Order Block Trading (ICT Guide) — narrows the pairing question specifically to order block entries.
- Daily/Weekly Bias Determination & Trade Journaling — how to build the HTF bias your LTF entries depend on.
- Why ICT Setups Need Both Time and Price — why timeframe alone isn't enough without kill-zone timing.
- A Practical ICT Trading Model for Part-Time Traders — a slower pairing built around a limited screen schedule.