
What Is Top-Down Analysis in ICT?
Top-down analysis is the practice of reading the chart from the largest timeframe downward, letting each level constrain the next. You start with a directional read on the higher timeframe, then drop down only to execute what that read already implied.
The logic rests on fractals: price structure repeats across timeframes, so a swing on the weekly and a swing on the five-minute obey the same rules. That is why the same tools work at every level.
Done properly, top-down analysis removes the guesswork of staring at one chart. Each timeframe answers a different question—direction, location, timing—so your final entry is a conclusion, not a hunch.
The Timeframe Hierarchy
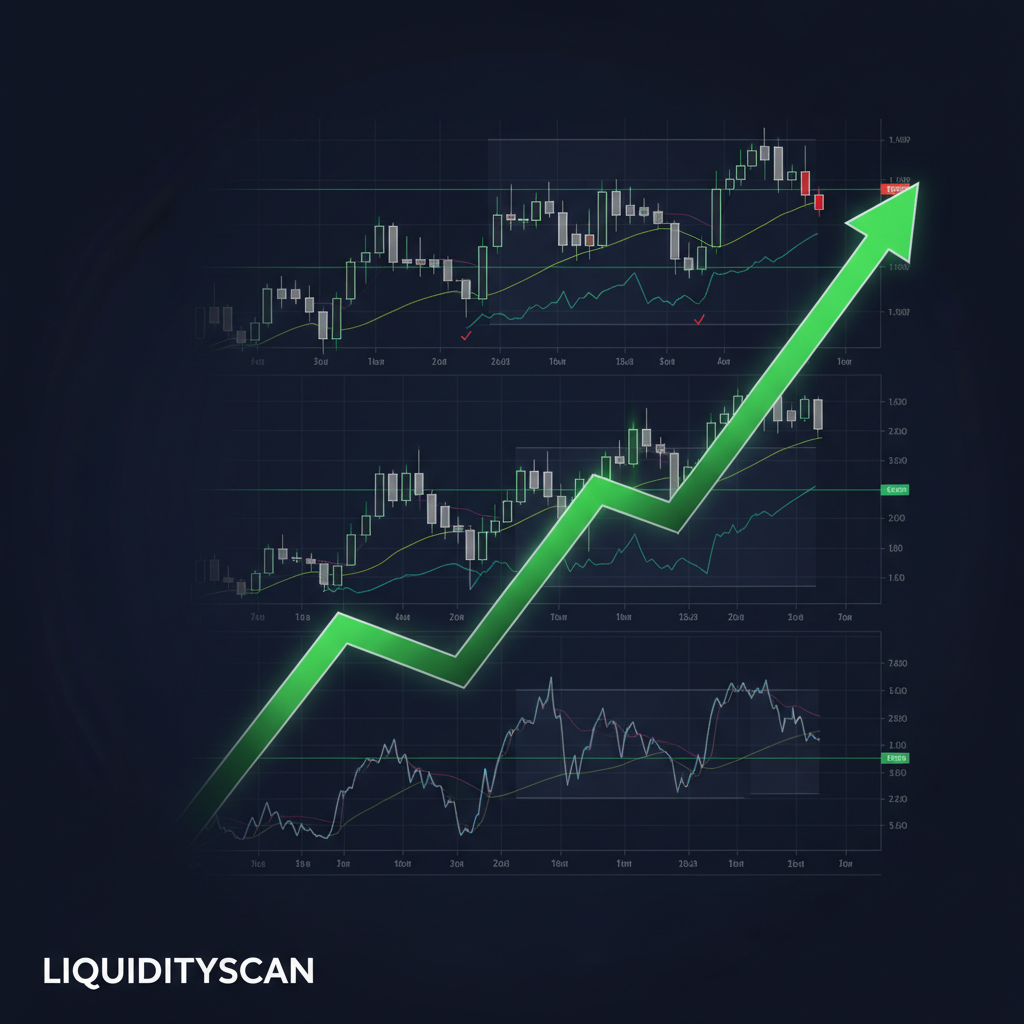
Think of three layers. The higher timeframe (HTF) sets the narrative: where price is likely heading over days or weeks. The intermediate timeframe maps where liquidity and points of interest sit inside that narrative.
The lower timeframe (LTF) is purely for entry timing—it tells you when to press the button, not which way to face. A common triad is weekly/daily for narrative, 4-hour/1-hour for structure, and 15-minute or 5-minute for entry.
The pairings shift with your style, but the roles never do. Higher decides direction, intermediate decides location, lower decides the moment. Keep those jobs separate and the chart stops feeling contradictory.
Step 1: Set Higher-Timeframe Bias
Bias is your directional lean. On the HTF you read market structure—are highs and lows building upward or breaking downward—and combine that with premium/discount pricing to decide whether you want to be a buyer or a seller.
If price is in a discount relative to the dealing range and structure is bullish, you lean long. If it trades at a premium into a bearish structure, you lean short. This single decision governs everything below it.
I write my HTF bias down before I look at any smaller chart. If I cannot state it in one sentence, I am not ready to trade—I am still guessing, and guessing belongs on a demo account.
Step 2: Map Intermediate Liquidity & POIs
With direction fixed, drop to the intermediate timeframe and mark where the market will likely react. These are your points of interest: order blocks, fair value gaps, and breaker blocks that align with your HTF bias.
Just as important, mark the liquidity pools—resting buy-side and sell-side stops above old highs and below old lows. Price is drawn to that liquidity, so it often signals the path between your current price and your POI.
The goal is a clean map: a directional bias from above and two or three high-quality zones where you would actually want to engage. Everything outside those zones is noise you can ignore.
Step 3: Refine the Entry on the Lower Timeframe
Now, and only now, drop to the entry timeframe. You are watching for price to reach an intermediate POI and then confirm your bias with a small-scale shift in structure—a break of a minor high or low in your intended direction.
This is where ICT traders look for a change of state: a liquidity sweep followed by a market-structure shift on the LTF, giving a defined risk point just beyond the swept level. Your stop sits where the idea is wrong; your target sits at the next liquidity draw.
Because the direction was decided two timeframes ago, the entry chart only has to answer "is it time yet?" That narrow question is far easier to answer well than "which way and when?" all at once.
Avoiding Timeframe Conflict
Conflict happens when a lower timeframe tempts you to trade against the higher one. A pretty bullish setup on the 5-minute means little if the daily is bearish and price sits at a premium—that setup is usually just fuel for the dominant move.
The discipline is hierarchy: the higher timeframe always wins the argument. When the LTF disagrees with the HTF, you either wait or you treat the LTF move as liquidity being taken before the real move resumes.
On LiquidityScan I keep the HTF bias pinned in view so an appealing entry chart cannot quietly hijack my direction. If a setup requires me to ignore my own higher-timeframe read, that is my cue to skip it entirely.
Multiple time frame analysis is a long-established idea in trading; Investopedia describes it as reading long-term trends first, then zooming in for precision (Investopedia). ICT simply adds liquidity and premium/discount to that scaffolding.
Frequently Asked Questions
How many timeframes should I use for ICT top-down analysis?
Three is the standard: one for bias, one for liquidity and POIs, and one for entry. More than three tends to create conflict and analysis paralysis rather than added clarity.
Which timeframe sets the bias?
The highest one in your triad—typically the daily or weekly. It defines direction, and every lower chart must respect it; the entry timeframe never overrides it.
Can I trade against my higher-timeframe bias?
Generally no. Counter-bias moves on lower timeframes are usually liquidity grabs. If you take them, treat them as scalps with tight risk, not as your primary edge.
Related query paths
These guides cover the prerequisites each step of top-down analysis assumes.
- Market structure in ICT — the structure you read at each level.
- PD arrays and premium/discount — HTF pricing that anchors your bias.
- Daily/weekly bias determination — how to lock in the directional read.
- ICT market structure framework — the full structure system behind each timeframe.
- Best ICT Timeframes: HTF Bias to LTF Entry Guide