
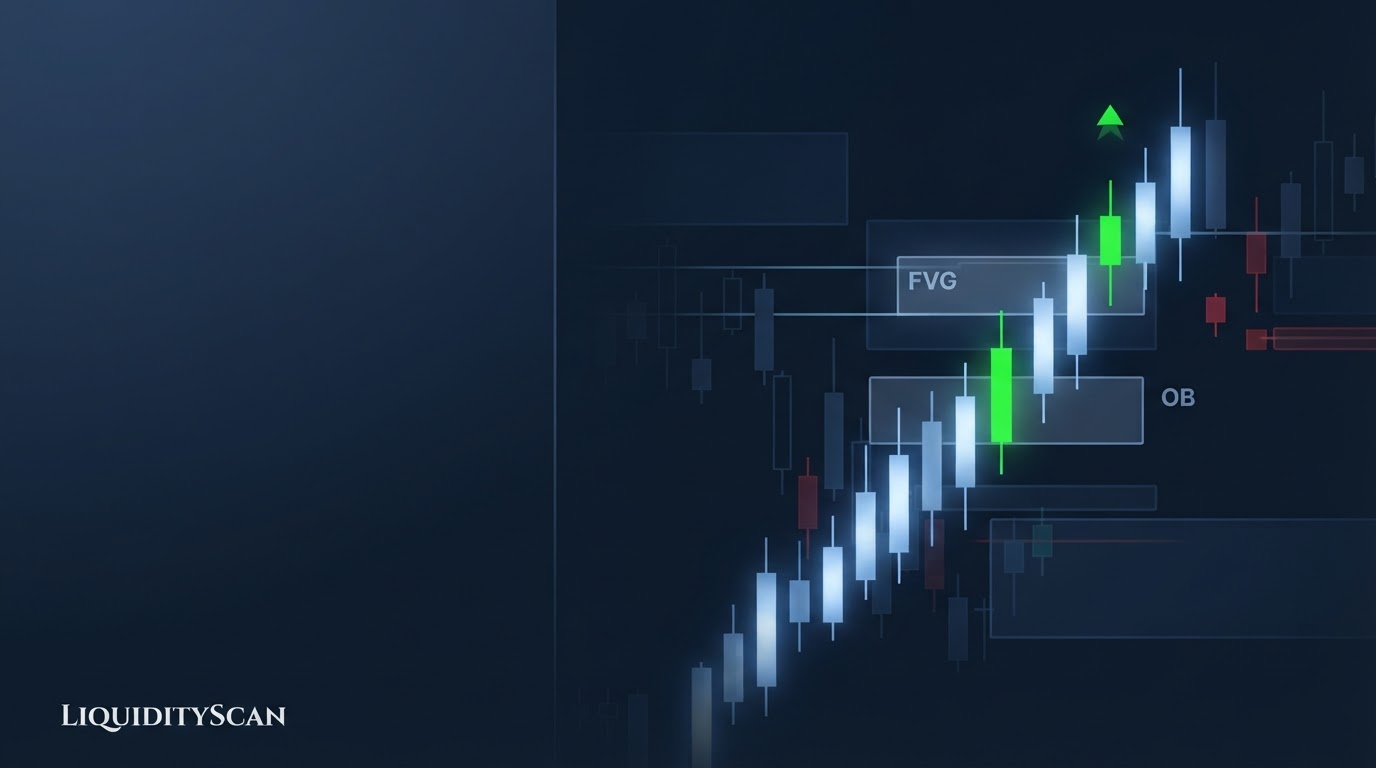
What Is Institutional Order Flow?
Institutional order flow is the aggregate directional intent of large market participants — banks, funds, and dealing desks — inferred directly from price structure. In the ICT framework you read it from displacement, unmitigated zones, and the swing sequence, not from volume feeds.
That definition matters because the phrase means two different things in trading. To a footprint or tape trader, order flow is executed volume: contracts hitting the bid or lifting the offer, measured tick by tick.
To an ICT trader, order flow is the result of those executions printed on the chart — the direction price is being delivered, and the zones left behind by whoever forced that delivery.
The ICT claim is simple: when participants large enough to move the market commit in one direction, the chart cannot stay neutral. Delivery becomes one-sided, pullbacks become shallow and engineered, and the market starts respecting a specific set of levels. Reading institutional order flow means reading those symptoms in sequence, on nothing more than open, high, low, and close.
This article covers the mechanism (why size cannot hide), the four-layer reading stack ICT traders use, bullish and bearish checklists, how structure-read flow differs from order-flow tools, and a worked BTCUSDT example — plus the mistakes that make traders see institutions in every candle.
Why Institutions Cannot Hide Their Order Flow
An institution's core problem is size relative to available liquidity. The BIS Triennial Survey puts global FX turnover above $7 trillion per day, yet the resting liquidity at any single price is a tiny fraction of that.
A desk that needs to buy $2 billion of EURUSD cannot fill at one tick — it would drive price straight through the book and destroy its own average entry.
So large orders are worked over time. Execution algorithms slice the parent order into thousands of child orders, filled across hours or days, ideally into opposing liquidity: sell-side stops below lows when accumulating, buy-side stops above highs when distributing.
The order is hidden at the tick level. It is not hidden at the structural level, because working size leaves three footprints no algorithm can erase:
- Displacement. At some point the position is filled and the desk stops absorbing. Price releases in an energetic, full-bodied leg because one side of the book is simply gone.
- Unmitigated zones. The candles where the final tranche was executed — the origin of the displacement — mark prices where institutional interest was proven. If price never returns there, the zone stays "unfinished."
- One-sided delivery. After the release, pullbacks stay shallow and corrective while expansions in the flow direction are impulsive. The asymmetry itself is the signature.
None of these footprints requires seeing a single order. They are geometric consequences of moving size through a finite book, which is why an ICT trader can infer institutional order flow from a bare candlestick chart.
The ICT Reading Stack: Four Layers of Structural Evidence
Reading institutional order flow is not one signal; it is a stack of four observations that must agree. Work through them in order, from the individual candle up to the swing sequence.
Layer 1: Candle science — bodies are delivery, wicks are rejection
The candle body shows where price was delivered and accepted; the wick shows where it was offered and refused. Three consecutive 4H candles closing within 15% of their highs is one-sided bullish delivery — buyers absorbed every offer. Long upper wicks into a level, with bodies closing back below, is rejection: someone is selling into strength there.
Body-versus-wick reading is the atomic unit of the stack. A trend built on full bodies is institutional; a trend built on wicks and marginal closes is a market drifting on thin participation, and it flips easily.
Layer 2: Displacement legs — the release of a worked position
Displacement is a run of large-bodied candles in one direction, typically covering 1.5–2× the average candle range or more, that breaks a meaningful level and leaves gaps behind. It is the moment accumulation stops being quiet.
If BTCUSDT ground sideways between 58,400 and 59,600 for four days and then printed three 4H candles to 63,200, that leg — not the range — is the institutional statement.
Distinguish displacement from a news spike: displacement holds. Bodies close near the extreme, the level that broke is not reclaimed, and follow-through arrives within a few candles. A spike that fully retraces within the session was liquidity being taken, not flow being revealed.
Layer 3: Order blocks and FVGs — evidence of unfinished business
Displacement leaves two artifacts. The Order Block is the last opposing candle (or cluster) before the leg — the zone where the final tranche of the position was filled against resting liquidity. The Fair Value Gap (FVG) is the imbalance inside the leg itself, a price range delivered so fast that only one side of the market traded there.
Both are evidence, not magic. An unmitigated bullish order block says: institutions proved willingness to buy here and price has not yet returned to let them add or defend. Stacked unmitigated bullish zones below price, with none above, is a structural map of where the size in this market is positioned — and therefore which direction it needs price to go.
Layer 4: The swing sequence — flow as cadence, not a moment
Zoom out and the footprints arrange into a sequence. Bullish institutional order flow prints higher highs and higher lows, where each higher low forms at a prior demand artifact (order block or FVG) and each higher high comes via displacement. Each Break of Structure (BOS) confirms the flow is still being worked.
The flip is equally structural. Price fails to make a new high, then displaces through the most recent higher low — a Change of Character (CHoCH).
In flow terms: the buy program is done, and the first sell-side displacement plus the first bearish order block mark redistribution. One CHoCH is a warning; a CHoCH followed by a lower high and a bearish BOS is a completed handover of order flow.
Bullish vs Bearish Institutional Order Flow: The Checklists
Run these before assigning a directional bias. You want at least four of five, on the timeframe you draw bias from — and the more items that fail, the closer the market is to transition rather than trend.
Bullish order flow checklist:
- Sequence of higher highs and higher lows; the most recent structural break was a bullish BOS, not a bearish CHoCH.
- Expansions up are displacement (full bodies, FVGs left behind); pullbacks down are corrective, overlapping, and wick-heavy.
- Unmitigated bullish order blocks and FVGs sit below price and are respected on first touch.
- Bearish zones overhead are being violated: price trades through old supply and closes above it.
- Sell-side liquidity (old lows, equal lows) gets swept and immediately reclaimed, while buy-side pools above act as the Draw on Liquidity.
Bearish order flow checklist is the mirror image:
- Lower highs and lower lows; latest break is a bearish BOS.
- Downside legs displace; rallies are corrective and stall inside old imbalances.
- Unmitigated bearish order blocks and FVGs cap price from above and hold on retest.
- Old demand zones below are trading through — mitigation fails, closes print beneath them.
- Buy-side sweeps above equal highs reverse quickly, while sell-side pools below keep getting run.
Note what is absent from both lists: volume, indicators, and opinions. Every item is a structural fact you can mark on a chart and audit afterward.
Structure-Read Flow vs Order-Flow Tools: Footprint, DOM, and Tape
One clarification, because the shared vocabulary confuses traders. Footprint charts, the DOM, and time-and-sales measure order flow directly: executed volume at each price, resting limit orders, prints hitting bid or ask. ICT measures it inferentially, from the structure those executions produced. Neither is fake; they are different sensors pointed at the same phenomenon.
| Dimension | ICT structural reading | Order-flow tools (footprint / DOM / tape) |
|---|---|---|
| Data source | OHLC price structure only | Executed volume, bid/ask prints, resting book |
| What it captures | The result of institutional execution (delivery, zones, sequence) | The execution itself, tick by tick |
| Horizon | Any timeframe, including daily/weekly bias | Strongest intraday; book data decays in seconds |
| Market coverage | Anything with candles, including spot FX and crypto | Needs centralized volume; weak for spot FX, fragmented for crypto |
| Typical failure mode | Labeling random structure as institutional intent | Drowning in noise; spoofed or pulled liquidity |
The two can agree or disagree, and both cases are information. Agreement — price returns to an unmitigated order block while the footprint shows aggressive selling being absorbed into passive bids — is high-grade confluence.
Disagreement — the zone touches but the tape shows sellers pressing through stacked offers with no absorption — is an early warning that the zone will fail before the candle closes.
If you trade intraday futures, tools can time entries inside structurally chosen zones; if you trade higher-timeframe crypto or FX, structure alone carries the read.
Using Institutional Order Flow for Bias
The practical rule: trade with the side that owns the unmitigated zones, toward the liquidity that side needs. If bullish flow is intact, you are a buyer at discount arrays (unmitigated bullish order blocks, FVGs, the lower half of the dealing range) targeting buy-side liquidity.
You do not short into a stack of unmitigated demand because a resistance line looks close — that is trading against the participants who move price.
Multi-timeframe flow alignment
Institutional order flow is fractal, so read it top-down and let each timeframe answer one question:
- Daily/weekly — who owns the market? Direction of the last displacement, side of the unmitigated zones, current draw on liquidity.
- 4H/1H — where will they act? The specific unmitigated array within the higher-timeframe flow where a reaction is due.
- 15m/5m — are they acting? A CHoCH and fresh displacement at the zone, in the direction of the higher-timeframe flow, confirming the handover from correction back to expansion.
Alignment is the filter: a bearish 15m structure inside a bullish daily flow is usually just the corrective leg delivering price into the next demand array — a countertrend trap for anyone reading one timeframe in isolation.
Worked example: BTCUSDT
Daily: BTCUSDT displaces from 58,400 to 63,200 in three sessions, full-bodied candles, breaking a prior daily high at 61,800 — a bullish BOS. The leg leaves a daily FVG at 59,800–60,600 and the order block that launched it at 58,900–59,400. Flow verdict: bullish, unfinished business below, equal highs at 64,050 as the draw.
4H: price stalls at 63,200 and corrects — overlapping, wick-heavy candles, no bearish displacement. The pullback presses into the daily FVG, trading down through 60,500. Structure note: the 4H prints a lower low during this dip, which panics single-timeframe readers, but the daily flow never flipped — no daily CHoCH, zones intact.
15m: inside the daily FVG, price sweeps a cluster of equal lows at 60,500, wicks to 60,380, then displaces up through the 15m lower high at 61,020 — a 15m CHoCH with a fresh FVG at 60,700–60,850. That is the third layer confirming: the correction delivered price into an institutional zone, someone bought it with force, and the higher-timeframe flow resumes.
Long against 60,380, first objective the equal highs at 64,050. Tools like LiquidityScan automate exactly this kind of read — flagging displacement, unmitigated order blocks, and structure shifts across timeframes so the flow map is already drawn when the retest happens.
Common Mistakes When Reading Institutional Order Flow
Most failures come from compressing a multi-layer read into a single observation:
- Calling one candle "institutional." A single large candle is a data point; news, thin liquidity, or a liquidation cascade prints them daily. Institutional flow is a sequence — displacement that holds, zones that get respected, structure that breaks in one direction. Demand at least two layers of the stack before assigning intent.
- Fading unmitigated zones. Shorting into stacked unmitigated demand because price "looks overextended" is a direct bet against proven positioning. Overextended markets in genuine flow correct into zones, not through them.
- Ignoring the failed items on the checklist. Three of five bullish items with two hard failures (demand trading through, sweeps not reclaiming) is not "mostly bullish" — it is transition, and transition means stand down or trade smaller.
- Reading flow on one timeframe. Every 15m downtrend inside a daily uptrend looks bearish in isolation. Bias comes from the higher timeframe; the lower timeframe only times it.
- Treating every old candle as an order block. Without displacement leaving the zone and a liquidity event feeding it, it is just a candle. Unfinished business requires evidence that business happened.
Institutional order flow, read honestly, is a discipline of sequence: candle bodies, displacement, the zones left behind, and the swing cadence, checked across timeframes. Get the sequence right and the chart tells you which side is working size — and that answer, not any indicator, is your bias.
Frequently Asked Questions
Can retail traders actually see institutional orders?
Not directly — parent orders, dark-pool fills, and dealer inventory are private. What retail traders can see is the unavoidable consequence of those orders: one-sided delivery, displacement, and the zones left unmitigated. Structural reading works precisely because it needs the effect, not the order ticket.
Do I need Level 2 or footprint data to trade ICT concepts?
No. The ICT reading stack uses only OHLC structure, which is why it applies to spot FX and crypto where centralized volume data is incomplete. Footprint and DOM tools are optional confluence for intraday futures traders — useful for timing inside a zone, never required for establishing directional flow.
How long does an institutional zone stay valid?
Until it is mitigated or violated, not until a clock expires. A daily order block can act months later if price never returned. That said, freshness matters within a trend: first touch carries the highest probability, and zones left behind after structure flips against them lose their standing.
Is institutional order flow the same thing as Smart Money Concepts?
They overlap but are not identical. Smart Money Concepts is the broader retail framework (structure, liquidity, order blocks) derived from ICT teachings. Institutional order flow is the specific read within it: the current directional intent of large participants, judged from displacement, delivery, and which side's zones are being respected.
Related query paths
Institutional order flow sits on top of a network of structural concepts. These are the highest-leverage next reads, in the order a learning path would take them:
- What Is Market Structure in ICT? — the swing-sequence foundation every flow read is built on.
- Displacement in ICT: Reading Institutional Intent — a deep dive on the single strongest footprint in the stack.
- What Is an Order Block? — how the origin of a displacement leg becomes a tradeable institutional zone.
- BOS vs. CHoCH: The Definitive Guide for SMC Traders — the two structural breaks that confirm or flip order flow.
- ICT vs Footprint Charts — the full comparison of structural reading versus executed-volume tools.
- ICT Top-Down Analysis: Multi-Timeframe Alignment — the procedural version of the daily-to-15m flow alignment used here.
- Liquidity Sweep Then Structure Shift: The Stop-Hunt-to-Reversal Sequence — how it connects to liquidity sweep then mss.