
What Is the Liquidity Sweep Then MSS Sequence?
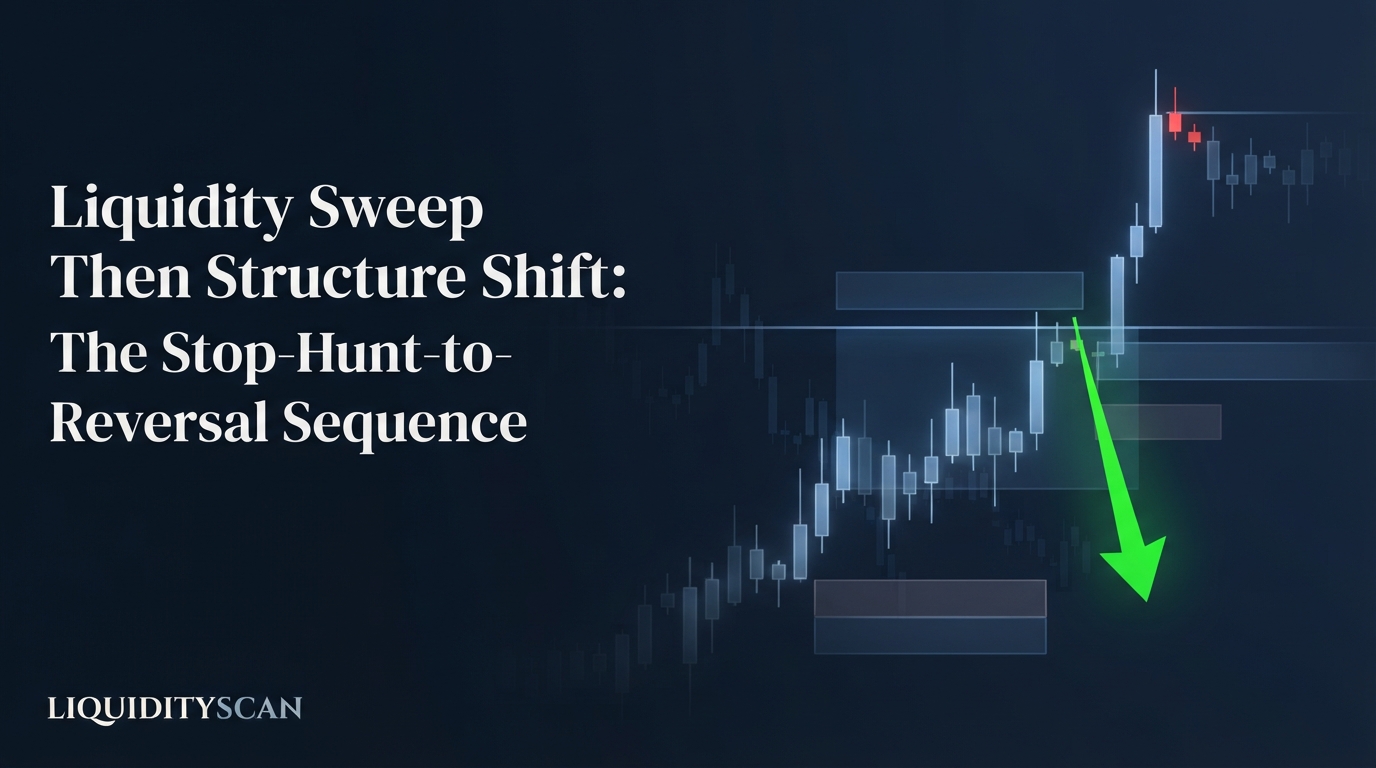
A liquidity sweep then MSS is a two-event reversal sequence: price wicks through a resting liquidity pool and closes back inside, then displaces the opposite way and closes through the swing that preceded the sweep. The sweep raises suspicion; the MSS confirms it.
The sequence exists because stops cluster in predictable places — above old highs and equal highs, below old lows and equal lows — since that is where retail invalidation naturally sits. Large participants need that resting order flow to fill size, so price is routinely delivered into the pool first.
What happens immediately after tells you the intent: acceptance beyond the level means expansion, while sharp rejection plus a structure break means the pool was fuel for the opposite move.
Each event alone is weak. A sweep of Buy-Side Liquidity (BSL) or Sell-Side Liquidity (SSL) is just a wick, and wicks appear at continuation points as often as reversals. A structure break on its own is a lagging breakout with no story behind it. Chained in order, each filters the other's false positives — which is why traders treat the pairing as ICT's highest-probability reversal signature.
One Sequence, Many Names
You already know this sequence under other labels. The Judas Swing is the same mechanic anchored to a session open: a false run at London or New York that sweeps the overnight extreme before the real move. Turtle Soup, borrowed from Linda Raschke and repurposed by ICT, is the failed breakout of a prior significant high or low.
The ICT 2022 Model is this exact chain packaged into a daily workflow: higher-timeframe draw, sweep, displacement through structure, entry on the retrace. The vocabulary changes; the causal chain does not.
Anatomy of the Stop-Hunt-to-Reversal Sequence, Step by Step
Four checkpoints, in strict order. Every one of them removes a specific class of false signal, and nearly every losing version of this trade comes from skipping one.
Step 1: A Higher-Timeframe Level Holding Resting Liquidity
Start with a level that objectively holds orders: an old daily or weekly high or low, Equal Highs / Equal Lows (EQH/EQL), the previous day's extreme, or a session high or low. The more visible and more often tested the level, the more stops and breakout orders rest beyond it.
This step filters scale. A wick through some 5-minute swing nobody marked carries no institutional information — there was nothing meaningful to sweep. A wick through a level visible on the 4H chart means real resting orders were consumed, and the market's response to that consumption becomes readable.
Step 2: The Sweep — Wick Through, Close Back Inside
Price trades beyond the level, fails to hold, and the candle closes back inside the prior range. The wick tells you orders beyond the level were filled and immediately rejected. The close location is the entire distinction: a body close beyond the level is a potential genuine breakout, not a sweep, and the sequence is off until price closes back inside.
Step 3: Displacement in the Opposite Direction
Within the next few candles you need Displacement: large-bodied, one-sided candles driving away from the swept level, typically leaving a Fair Value Gap (FVG) behind. The mechanism matters — only aggressive institutional repricing consumes passive liquidity fast enough to leave an imbalance. A slow, overlapping drift back from the wick means positions are being re-accumulated for another push, not reversed. No displacement, no intent, no setup.
Step 4: The MSS — Close Through the Pre-Sweep Swing
Identify the swing that produced the run into the pool. For a buy-side sweep, that is the last higher low before the high; for a sell-side sweep, the last lower high before the low. A candle body closing through that swing is the Market Structure Shift (MSS) — the moment delivery demonstrably changes direction.
Body close is non-negotiable: wicks pierce intraday swings constantly, and requiring the close removes that ambiguity. In Change of Character (CHoCH) and Change in the State of Delivery (CISD) terms, this is the confirmation bar of the whole sequence.
Sweep Without Shift vs Shift Without Sweep
Both halves are necessary. Here is what each configuration alone usually turns into, and why only the ordered pair is tradable.
| Configuration | What it usually is | Typical failure | Verdict |
|---|---|---|---|
| Sweep, no structure shift | A wick through the level with no displacement behind it — often the first leg of acceptance and continuation | You short the wick top, price re-tests, closes through, and runs; your stop is the next pool | An observation, not an entry |
| Structure shift, no sweep | A breakout in the middle of a range with no liquidity event fueling it | The break runs directly into an untouched opposing pool and reverses — you become the liquidity | A lagging breakout trade |
| Sweep, then MSS | An engineered stop hunt reversed by displacement through structure | Failure is well-defined: price trading back beyond the sweep extreme | The tradable sequence |
The sweep-only failure is an information problem: a wick tells you orders were filled out there, not who won the auction. Buyers absorbing a sell-side sweep and sellers defending a failed high produce identical wicks until structure breaks.
The shift-only failure is a positioning problem: without a preceding purge, the pool that should have been cleared still sits ahead of your entry — and price is drawn to it. Requiring the liquidity sweep then MSS in that exact order solves both at once.
Entry Models After the MSS
The MSS candle itself is usually extended — displacement did its job — so entering at market on the close buys the worst price of the leg and wrecks the R multiple. Professionals wait for the retrace into one of two zones the displacement leg created.
Entry 1: The FVG Left by the Displacement Leg
The imbalance the displacement carved out is the default entry. Set a limit inside the gap; the refined version rests at Consequent Encroachment — the 50% midpoint of the FVG — since deep deliveries frequently reach it before reversing. If the leg left several gaps, prefer the one nearest the origin of the move rather than the one nearest current price.
Entry 2: The Order Block at the Origin
The last opposite-direction candle before displacement launched is the Order Block of the sequence. It frequently overlaps the FVG, and that overlap is the highest-conviction zone on the chart — the same territory the Unicorn Model formalizes when a breaker aligns with the gap. A limit at the block's open or midpoint gives a slightly deeper fill at the cost of more misses.
Stop: Beyond the Sweep Extreme
The stop belongs beyond the wick that swept the pool, plus a spread-and-noise buffer. The logic is structural, not cosmetic: the sequence's thesis is that the sweep terminated the move. If price trades beyond that extreme, the pool wasn't fuel — it was the start of expansion — and the thesis is dead. Placing the stop inside the wick converts a valid idea into a donation.
Targets: The Opposing Pool
After the MSS, the Draw on Liquidity flips. First objective is internal range liquidity — the displacement leg's extreme and any FVGs on the path. The terminal target is the opposing external pool: for a bearish sequence off swept buy-side, that means equal lows, an old low, or the previous day's low. Sweep one side, deliver to the other — that is the whole ICT delivery narrative in one sentence.
Timing Filter: Why Sweeps at Session Opens Carry Intent
Identical sequences grade differently by clock. Kill Zones — London open (roughly 02:00–05:00 New York time) and the New York AM session (07:00–10:00) — are when institutional volume actually arrives, and they are when false moves are engineered on purpose.
The Asia range high or low swept in the first hour of London, or the London extreme swept at the New York open, is the textbook Judas print: a run designed to fill size against the crowd before the daily range expands the other way.
A sweep at 15:00 New York time in dead liquidity is, more often than not, noise — there is no session's worth of orders behind it and no institutional window to fuel displacement.
Time filters price: the same four-step anatomy inside a kill zone and outside one are not the same trade. LiquidityScan's liquidity sweep and market structure scanners flag sweep-then-shift sequences across pairs and timeframes in real time, which removes the need to manually babysit every session open.
What Invalidates a Liquidity Sweep Then MSS Mid-Formation
The sequence takes several candles to complete, so you need explicit kill criteria while it is forming:
- No displacement. Three to five candles after the sweep, all you see is small-bodied, overlapping chop drifting back toward the level. That is re-accumulation, not rejection — stand down.
- Structure holds. Price pulls away from the wick but never body-closes through the pre-sweep swing, then builds a higher low (after a buy-side sweep). The sweep was a shakeout inside a continuation, and the next leg likely goes with the original trend.
- The sweep keeps extending. Successive candles close beyond the swept level. There is no sweep anymore — there is a breakout, and the level has flipped roles.
The Biggest Mistake: Front-Running the MSS
Entering on the sweep candle itself — before displacement, before the structure close — feels early and buys a better price, but it strips out the exact confirmation that gives this sequence its edge. You are trading a wick, and a wick is statistically close to a coin flip. The pattern's filter is the shift; skipping it converts the setup back into the sweep-only row of the table above.
Three smaller leaks compound the damage: tucking the stop inside the sweep wick where ordinary noise reaches it, chasing displacement at market instead of waiting for the retrace, and calling an MSS on a micro-swing no other participant would mark. If the swing you used is invisible on the timeframe above, it did not shift anything.
Worked Example: BTCUSDT Sweep Then MSS With Full R Math
Setup: BTCUSDT prints 4H equal highs at 68,400 and 68,420 across two days — engineered buy-side, with stops from shorts and breakout buy orders stacked above 68,420. The daily chart sits in the premium half of its dealing range, so a bearish resolution has higher-timeframe context.
At 09:15 New York time, inside the AM kill zone, a 15-minute candle spikes to 68,690 and closes at 68,310 — through the pool, closed back inside. Step 2 complete.
The pre-sweep swing is the 15-minute higher low at 67,600 that launched the run into the highs. Over the next three candles price displaces to 67,150, leaving a fair value gap between 67,880 and 68,060. A 15-minute body close at 67,540 seals the MSS through 67,600. Sequence complete.
Execution: limit entry at 67,950 inside the FVG, 20 points below its consequent encroachment at 67,970. Stop at 68,750 — 60 points beyond the 68,690 sweep extreme. Risk: 800 points.
Target: the opposing pool at the 4H equal lows of 66,200. Reward: 1,750 points, a 2.19R trade; a partial at the displacement low of 67,150 banks 1R along the way. Risking 1% of the account, the full target returns roughly 2.2%. The retrace filled at 10:05, still inside the kill zone — time and price agreeing.
Run the same anatomy on your own markets before trusting it with size. The liquidity sweep then MSS sequence is not a shape to memorize but a causal chain to verify — pool, purge, displacement, shift — and every checkpoint you skip hands its false signals straight back to you.
Frequently Asked Questions
Is a liquidity sweep the same as a stop hunt?
Functionally, yes. "Stop hunt" describes the intent — running price into clustered stop orders — while "liquidity sweep" describes the mechanic ICT traders chart: the wick through a pool and the close back inside. Both refer to engineered runs into resting orders; the sweep label simply comes with objective, chartable criteria.
How long after the sweep should the MSS appear?
Within the same session, and ideally within a handful of candles on your execution timeframe. Displacement is by definition immediate — that urgency is the signal. The longer the market drifts after the wick, the weaker the rejection case becomes; if a full session passes without a structure close, treat the sweep as stale and re-map.
Can the sweep-then-MSS sequence be traded with the trend instead of as a reversal?
Yes, and those are often the best expressions. In an uptrend, a pullback that sweeps sell-side liquidity below an intermediate low and then shifts structure back up is a continuation entry aligned with higher-timeframe order flow. Counter-trend sequences work too, but they demand larger swept pools and deliver shorter targets.
What win rate should I expect from this setup?
There is no universal number, and anyone quoting one precisely is selling something. As a rough illustration, community backtests tend to cluster in a broad 35–55% band depending on session filter, displacement quality, and higher-timeframe alignment — workable because winners target 2R or more. Journal your own fills for 50-plus occurrences before trusting any figure.
Related query paths
Where to go next, in the order the concepts build on each other:
- What Is a Liquidity Sweep? — the first event of the sequence defined from scratch, with identification rules.
- Liquidity Sweep Explained: The ICT Stop Hunt — deeper mechanics of who runs the stops and why the wick forms.
- CHoCH vs MSS: The Real Difference in ICT — precise definitions of the second event and how the labels differ.
- Displacement in ICT: Reading Institutional Intent — how to grade the leg that separates real reversals from drift.
- Judas Swing vs Turtle Soup: An ICT Trader's Guide — the two named variants of this sequence compared head to head.
- ICT 2022 Model vs 2024 Model: Key Differences — how the sweep-then-shift chain gets packaged into a complete daily model.
- What Is Institutional Order Flow and How Does Structure Reveal It? — how it connects to institutional order flow.