
What Is a CRT Scanner?
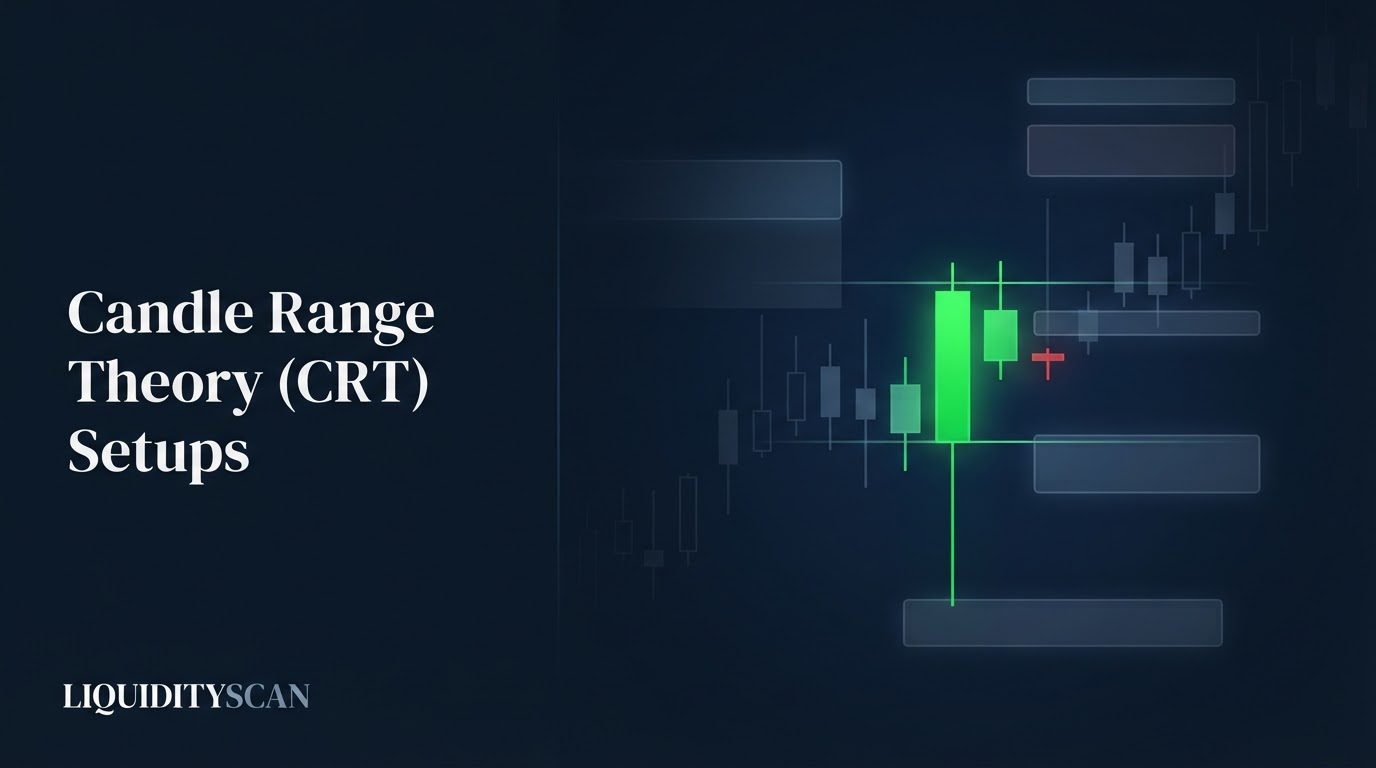
A CRT scanner is an automated tool that watches many pairs and timeframes for one Candle Range Theory pattern: a candle whose wick pushes beyond the prior candle's high or low to grab liquidity, then closes its body back inside that prior range.
Instead of flipping through charts, you read a feed of detected setups.
The value is coverage and discipline. Candle Range Theory setups are simple to define but easy to miss, because they only complete on a candle close and can print on any symbol, in any session, on any timeframe.
A scanner checks all of them the moment each candle closes, so nothing slips past while you sleep or focus on one chart. LiquidityScan's CRT engine does exactly this and grades each result so you can judge quality before you open the chart.
Doing this by hand is what breaks down at scale. Manual CRT hunting means re-checking hundreds of pairs rather than a watchlist, on multiple timeframes at once, across the Asian, London, and New York sessions.
You also have to confirm the exact rule every time, so you do not mistake an ordinary rejection wick for a genuine sweep of the prior range. No trader can re-scan a whole market list every hour without missing setups or burning out. That repetitive verification is precisely the job a scanner removes.
Candle Range Theory: The Sweep-and-Reclaim Logic
Candle Range Theory treats the previous candle's high-to-low span as a range that holds resting orders. Stops and pending orders cluster just beyond obvious highs and lows, so those extremes act as liquidity pools. When price pushes past one of them, it is often not a real breakout but a raid on that pooled liquidity.
The CRT signal is the failure of that break. A candle wicks above the prior high (or below the prior low), trips the stops sitting there, and then closes its body back inside the prior range. That rejection is the tell.
The move ran out of continuation, the sweep was the point, and price frequently rotates back the other way toward the opposite side of the range.
Read plainly, a bullish CRT is a downside sweep that fails: the wick takes out the prior low, but the body closes back inside, hinting the low was engineered rather than broken. A bearish CRT is the mirror: the wick takes out the prior high, the body closes back inside, and the upside break is rejected.
This is the same family of behavior described by a Liquidity Sweep and the broader idea of a Draw on Liquidity, compressed into a two-candle relationship.
What the CRT Scanner Detects
The engine encodes Candle Range Theory as a precise, testable rule applied to two closed candles. A setup only qualifies when all three conditions hold, which is what keeps the feed from filling with noise.
1. The wick sweeps the prior range
The signal candle's wick must extend beyond the prior candle's extreme: below the prior low for a bullish CRT, above the prior high for a bearish CRT. This is the liquidity grab. No sweep, no setup.
2. The body closes back inside the range
After the sweep, the signal candle's body must close back inside the prior candle's high-to-low range. This is the rejection that separates a real CRT from a clean breakout. If the body closes beyond the level, the range was broken, not swept, and it is not a CRT.
3. The signal candle has a smaller body
The signal candle's body must be smaller than the prior candle's body. A compact rejection body after a sweep reads as absorption and stalling momentum rather than fresh directional force, which is the behavior Candle Range Theory is built around.
Because these three checks are mechanical, the scanner applies them identically to every symbol and timeframe. There is no discretionary eyeballing, so a CRT on one obscure pair is held to the same standard as one on BTCUSDT.
The engine also keeps only the single latest CRT per symbol and timeframe, so you always see the current setup rather than a stack of stale ones.
How STRONG, WEAK, and FAILED Grading Filters Quality
Detection alone would flood you with every technically valid sweep, most of which lead nowhere. The CRT scanner adds a lifecycle grade based on what the next one to two candles actually do after the setup forms. This is a real filter, not cosmetic labeling.
- STRONG means follow-through confirmed the sweep. After the rejection, the next candles' body closes moved in the setup's direction, back into the range and beyond, which is the continuation you want to see from a genuine liquidity grab.
- WEAK means the setup formed but the confirmation was tepid, so price has not yet committed. It is a valid CRT that has not proven itself.
- FAILED means the follow-through never came, or price pushed back through the swept extreme, invalidating the read. The sweep was not the low or high after all.
Grading by body close on subsequent candles matters because it ignores wick noise and waits for candles to actually settle. In practice, you use the grade as a triage layer: STRONG setups earn a closer look, WEAK ones go on a watch, and FAILED ones are discarded evidence rather than trades.
The grade never becomes a win rate or a probability figure. It is a qualitative state describing how the setup has behaved since it printed.
Timeframe Coverage and Why No-Repaint Matters
The scanner runs CRT detection on the hourly-and-up timeframes (1h, 4h, 1d, 1w) plus the sub-hour timeframes 15m and 5m. That range lets you match the pattern to your style: a 1d or 1w CRT frames a swing-level sweep and higher-timeframe bias, while a 15m or 5m CRT gives an intraday, session-level entry read.
Every one of these detections happens on confirmed, closed candles only. The live, in-progress bar is always dropped before evaluation. This is what makes the signals non-repainting: a CRT that appears in the feed will not vanish or change once the candle it formed on has closed, because the detection was made from finished data.
No-repaint is not a nicety here, it is structural to how CRT is graded. The whole method depends on a wick that swept, a body that closed inside, and follow-through measured on later body closes. All three are only knowable once candles finish.
A tool that scored the forming candle would show you a setup that could evaporate on the next tick. By waiting for closes, the scanner reports something stable enough to act on and to review honestly afterward.
A Worked CRT Example and Daily Workflow
Suppose ETHUSDT on the 4h has been ranging, and the prior 4h candle printed a clean low that lines up with an obvious support where stops would sit. The next 4h candle wicks below that low, trips the resting sell stops, then closes its body back inside the prior candle's range with a smaller body than the prior candle.
That is a bullish CRT: a downside sweep that failed. The scanner surfaces it the moment the 4h candle closes.
Over the following one to two 4h candles, price closes back up into the range. The engine grades the setup STRONG. Now you have a concrete, timestamped read that sell-side liquidity below that low was taken and rejected, on a timeframe that matters for your bias.
A repeatable daily workflow around this looks like:
- Scan surfaces the CRT and its grade. You open the feed, filter to the timeframes you trade, and note the STRONG and WEAK setups.
- You add higher-timeframe context. Does the sweep direction agree with your bias? A bullish CRT is far more interesting when the higher timeframe is bullish and price swept into a discount area rather than against a strong downtrend.
- You examine the swept level itself. Was it an obvious pool of liquidity, an equal low, a session low, a prior day's extreme? The more engineered the level looked, the more the sweep means.
- You execute on your own plan. The scanner has framed the setup and its direction. Your entry trigger, stop placement beyond the sweep wick, and target selection are yours to define and size.
The scanner compresses steps one and part of two. It does not replace three and four, which are where your edge and risk control live.
Manual CRT Hunting vs a CRT Scanner
The trade-off is straightforward: manual work gives you total context but limited coverage, while the scanner gives you full coverage and a consistent rule, then hands context back to you.
| Task | Manual CRT hunting | CRT scanner + grading |
|---|---|---|
| Pairs covered | A handful you can watch | The full scanned market universe |
| Timeframes | Whatever you flip through | 1h, 4h, 1d, 1w plus 15m and 5m |
| Sessions | Only while you are at the screen | Every candle close, around the clock |
| Rule consistency | Varies with attention and fatigue | Identical three-part rule every time |
| Quality read | Judged after the fact by eye | STRONG / WEAK / FAILED from later closes |
| Repaint risk | Tempted to act on the live candle | Closed-candle detection, no repaint |
| Entry, stop, target | You decide | You decide (scanner gives none) |
The honest limits of a CRT scanner
Be clear about what this tool is and is not. A CRT scanner surfaces a well-defined pattern and rates how it has behaved since forming. It does not do the following:
- It gives no numeric targets. CRT output is qualitative. There is no entry price, stop, or take-profit attached, and no risk-reward ladder. STRONG is a behavioral state, not a target or a forecast.
- The grade is not a win rate. STRONG, WEAK, and FAILED describe follow-through on closed candles, nothing more. The platform does not compute or publish accuracy percentages, and you should not read one into the labels.
- You still supply the risk. Position size, stop distance beyond the sweep, and whether the higher-timeframe context justifies the trade are your decisions. The scanner frames the setup; it does not manage the trade.
- Context is not optional. A STRONG CRT against a dominant trend, or sweeping a level nobody cares about, is far weaker than the grade alone implies. The grade is one input among several.
Used with that framing, a CRT scanner is a coverage and consistency engine. It finds every valid Candle Range Theory sweep across the market on closed candles, grades the follow-through so you can triage, and lets you spend your attention on context and risk rather than on flipping through charts.
Frequently Asked Questions
Is a CRT the same as a liquidity sweep?
A CRT is a specific, two-candle form of liquidity sweep. Any sweep is a push past a level to grab stops. Candle Range Theory adds precise conditions: the wick must sweep the prior candle's extreme, the body must close back inside that prior range, and the signal candle's body must be smaller than the prior one.
What timeframe is best for CRT setups?
There is no single best timeframe; it depends on your style. Higher timeframes like 1d and 1w frame swing-level sweeps and bias, while 15m and 5m give intraday, session-level reads. Many traders use a higher-timeframe CRT for direction and a lower-timeframe one for timing, so coverage across both matters.
Does the CRT scanner repaint or change signals later?
No. Detection runs only on confirmed, closed candles, and the live forming bar is always dropped. A CRT that appears after a candle closes will not vanish or change on later ticks. The STRONG, WEAK, and FAILED grade updates from subsequent closed candles, but the original detection stays fixed.
Can a CRT scanner tell me where to enter and exit?
No. CRT output is qualitative, with no entry, stop, or target attached. The scanner identifies the sweep-and-reclaim pattern and grades its follow-through. You decide the trigger, the stop beyond the sweep wick, the target, and the position size based on your own plan and risk.
Related query paths
Work outward from the sweep mechanics that underpin Candle Range Theory into structure, sequences, and how automated scanning fits your routine.
- Liquidity Sweep Explained: The ICT Stop Hunt — the core mechanic a CRT is built on, in full.
- Why Price Reverses After a Liquidity Sweep — the order-flow reason a failed sweep rotates.
- Swing High and Swing Low: 3-Candle Rule — how to identify the levels a CRT sweeps.
- Liquidity Sweep Then MSS: Reversal Guide — extend a CRT into a confirmed structure shift.
- Order Block Scanner: Real-Time OB & FVG — pair CRT reads with automated zone detection.
- Best ICT Scanner: How to Choose — how to evaluate scanners for your workflow.
- How to Catch Asian-Range Sweeps Every Session — a related angle on asian range sweep scanner.