
What Is a Swing High and Swing Low in ICT?
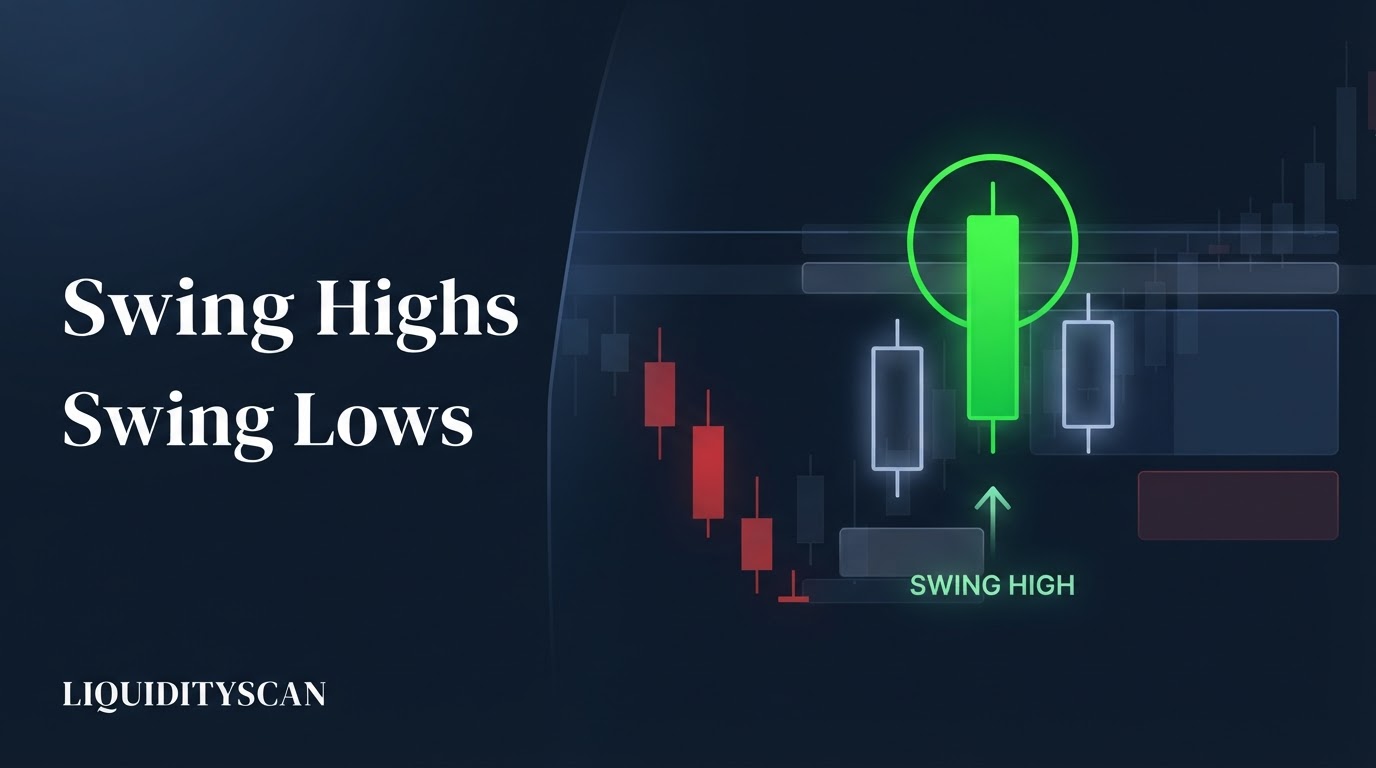
A swing high is a candle whose high exceeds the highs of the candles immediately before and after it. A swing low is a candle whose low is below both neighboring lows. This three-candle pattern is the smallest objective unit of ICT market structure.
That is the entire definition. No indicators, no subjective trendlines — just three candles and a strict comparison. The middle candle of a swing high is the local point where buying pressure exhausted and sellers took delivery. The middle candle of a swing low is where selling pressure exhausted and buyers stepped in.
Everything else in the Inner Circle Trader (ICT) and Smart Money Concepts (SMC) toolkit is assembled from these points. A Break of Structure (BOS) is price closing beyond a swing point. A Change of Character (CHoCH) is price violating the opposite-side swing. Buy-Side Liquidity (BSL) rests above swing highs, sell-side liquidity below swing lows. If your swing points are marked inconsistently, every downstream read — bias, structure, liquidity — inherits the error. That is why the 3-candle rule matters: it makes the foundation mechanical instead of aesthetic.
The 3-Candle Rule Explained
The rule in precise terms, for any three consecutive candles C1, C2, C3:
- Swing high: the high of C2 is strictly greater than the high of C1 and strictly greater than the high of C3.
- Swing low: the low of C2 is strictly lower than the low of C1 and strictly lower than the low of C3.
Two properties follow directly. First, a swing point is only confirmed when C3 closes — while C3 is still forming, the pattern can be negated by a late wick. Marking swings on live, unclosed candles is how traders end up with structure maps that quietly repaint. Second, the same candle can be both: a wide-range candle with a higher high and lower low than both neighbors is simultaneously a swing high and a swing low — common on news candles, and both levels are valid references.
Why three candles and not five?
Three candles is the minimal fractal unit — the smallest window in which a local extreme can exist at all. With two candles you can only say one high is above another; you cannot say pressure reversed on both sides of a point. Bill Williams' classic fractal indicator uses the same logic with a five-bar window (two lower highs on each side). ICT's convention tightens that to three bars, which detects turns earlier and produces more swing points per chart. Nothing about the market changes between the two settings; only sensitivity does. Five-bar fractals filter noise but lag; three-bar swings react faster but require the hierarchy below to separate signal from noise.
Short-Term, Intermediate-Term, and Long-Term Swing Hierarchy
Because the 3-candle rule fires often, ICT ranks swing points into three tiers rather than treating them equally:
- Short-term high (STH): any raw 3-candle swing high. Short-term low (STL) is the inverse.
- Intermediate-term high (ITH): a short-term high that has a lower short-term high on both sides of it. In other words, apply the 3-candle logic again — but to the swing points themselves instead of the candles.
- Long-term high (LTH): an intermediate-term high flanked by lower intermediate-term highs on both sides.
This nesting rule is recursive and elegant: the same fractal comparison at three zoom levels. It also explains why structure looks the same on a 5-minute chart and a weekly chart — price delivery is fractal, so the identical rule generates the identical geometry at every scale.
Practically, the hierarchy tells you which swings matter for which decision. Short-term swings define entry-level structure and tight stop placement. Intermediate-term swings define the dealing range you are actually trading inside. Long-term swings define the higher-timeframe Draw on Liquidity — where price is ultimately reaching. A break of an STH means little if the ITH above it is intact; a break of an ITH is a genuine structural event.
How Swing Highs and Swing Lows Define Market Structure
Market structure is nothing more than the sequence your confirmed swing points print in:
- Uptrend: higher highs (HH) and higher lows (HL) — each new swing high above the last, each new swing low above the last.
- Downtrend: lower highs (LH) and lower lows (LL).
- Range: swings failing to make progress in either direction, often printing equal extremes.
The two structural events traders act on are defined relative to swings. A Break of Structure (BOS) occurs when price closes beyond the most recent swing point in the direction of the prevailing trend — a close above the last swing high in an uptrend confirms continuation. A Change of Character (CHoCH) occurs when price closes beyond the swing point on the opposite side — a close below the last higher low in an uptrend is the first objective evidence the trend may be ending.
Notice that neither event exists without a correctly marked swing. If you marked a minor STH as your reference high, you will call a BOS that intermediate-term structure never confirmed. If you missed an inside-bar trap (covered below), your CHoCH level sits at the wrong price entirely. Swing accuracy is structure accuracy.
Swing Points Are Liquidity
The second reason ICT traders obsess over swing points: stops cluster beyond them. A trader who buys a higher low places a protective sell stop under that swing low. A trader who shorts a lower high places a buy stop above that swing high. Multiply by thousands of participants using the same textbook logic, and every visible swing point becomes a resting pool of executable orders — Buy-Side Liquidity (BSL) above swing highs, sell-side liquidity (SSL) below swing lows.
Large participants need that resting liquidity to fill size without moving price against themselves. This is why price so often trades a few ticks beyond an obvious swing point, fills the stops, and reverses — a Liquidity Sweep rather than a genuine break. The mechanical distinction: a sweep takes the level by wick and closes back inside; a break closes beyond it with displacement.
Equal swings are engineered pools
When two or more swing highs form at nearly the same price — Equal Highs (EQH) — the liquidity above them compounds. Retail sees a double top and a "strong resistance" level; the institutional read is the opposite: an engineered magnet. Each retest that respects the level adds another layer of breakout stops above it and short-seller stops behind it. ICT's position is that clean, obvious equal swings rarely hold on the third approach; they get purged. Equal lows work identically in mirror. When mapping swings, flag any pair of highs or lows within roughly 0.1–0.3% of each other on your trading timeframe as a probable engineered pool rather than a wall.
Common Mistakes When Marking Swing Highs and Lows
The definition is mechanical, but application still fails in predictable ways:
- Mixing wicks and bodies inconsistently. Swing points and liquidity levels are defined by wicks — the actual extreme where stops rest. Structure breaks are judged by candle closes. Traders who mark swings by body one day and wick the next produce structure maps that disagree with themselves. Pick the convention: wicks for the level, closes for the break.
- Counting inside bars as swings. An inside bar — a candle whose entire range sits within the prior candle — can never be a swing high or low by strict inequality, and its neighbors need care too. A common trap: candle B is inside candle A, candle C pushes slightly above B but not A. B's high was never the local extreme; A's was. Marking B creates a false reference level several ticks too low.
- Ignoring strict inequality at equal highs. If C2's high exactly equals C1's high, the 3-candle rule does not fire. That is a feature, not a bug — equal extremes are a liquidity pool, not a confirmed swing. Mark the pool, wait for the sweep or break.
- Confirming swings before the third candle closes. Live-candle swings repaint. If your marked structure keeps "disappearing," this is why.
- Flat hierarchy. Treating every STH as a BOS reference produces a new "structure break" every few candles. Anchor bias to intermediate-term swings; use short-term swings only for entries and stops.
Doing this by hand across dozens of pairs is where discipline slips; LiquidityScan's Market Structure scanner applies the same 3-candle and BOS/CHoCH rules algorithmically across timeframes, which removes the marking inconsistency entirely.
Worked Example: Mapping Swings on BTCUSDT
Take a 1-hour BTCUSDT sequence. Price rallies from 61,800 and prints a candle with a high of 63,420; the candles before and after top out at 63,180 and 63,240. Strict inequality holds on both sides — 63,420 is a confirmed short-term swing high the moment the third candle closes.
Price pulls back. A candle prints a low of 62,510, flanked by lows of 62,690 and 62,740. Confirmed short-term swing low. Price then rallies and closes at 63,610 — a full body close above 63,420. That is a BOS: the uptrend sequence extends, and 62,510 is promoted to the higher low that now defines the trend. Any close below 62,510 later would be the CHoCH warning.
The rally continues to 64,350, stalls, retraces, then pushes to 64,365 — two highs 15 dollars apart, about 0.02%. The 3-candle rule never confirms the second push as a clean swing because the highs are effectively equal. Correct read: EQH, an engineered buy-side pool near 64,350–64,365, not resistance. Two sessions later price spikes to 64,410 on a single wick, closes back at 64,180, and sells off hard — a textbook sweep of that pool. The wick high 64,410 now stands as the intermediate-term high, because the short-term highs on both sides of it are lower.
Walk the sequence backward and every decision — where the BOS was valid, where the CHoCH would trigger, where liquidity was engineered — traces to correctly applied 3-candle swings. Rehearse this on your own charts: pick fifty closed candles, mark every strict 3-candle swing, then promote the intermediate-term points and check which breaks actually followed through. Master marking the swing high and swing low first; structure, bias, and liquidity are just arrangements of them.
Frequently Asked Questions
Is a swing high the same as a Williams fractal?
Same logic, different window. A Williams fractal requires the middle candle's high to exceed two candles on each side (five bars total); the ICT swing high requires only one on each side (three bars). The 3-candle version confirms two bars earlier and generates more swing points, which is why ICT layers the STH/ITH/LTH hierarchy on top to rank them.
Do swing highs and lows work the same on every timeframe?
Yes — the 3-candle rule is fractal, so it produces identical geometry on a 1-minute or weekly chart. What changes is significance: a weekly swing low carries far more resting liquidity and institutional relevance than a 5-minute one. Standard practice is to mark structure on the higher timeframe and execute against lower-timeframe swings inside it.
What happens when a swing high is broken?
It depends on how it breaks. A candle body closing above the swing high with displacement is a Break of Structure, signaling continuation and often leaving a Fair Value Gap behind. A wick that pokes above the high but closes back below it is a liquidity sweep — stops were taken, and reversal odds increase rather than decrease.
How many swing points do I need to define a trend?
Minimum two of each type: two ascending swing lows plus two ascending swing highs establish a higher-low, higher-high sequence — an objective uptrend. One swing alone is a data point, not structure. Most ICT traders anchor trend definition to intermediate-term swings so that routine short-term noise cannot flip their bias every few candles.
Related query paths
Swing points are the first layer of the structure stack. These are the natural next reads, in order:
- What Is Market Structure in ICT? — the parent concept: how swing sequences become trend, range, and bias.
- What is a Break of Structure (BOS)? — what it means when price closes beyond a confirmed swing point.
- Change of Character (CHoCH) Guide — the opposite-side swing violation that flags early reversals.
- BSL vs SSL in SMC: Identify Liquidity — mapping the stop pools that rest beyond swing highs and lows.
- Equal Highs & Equal Lows (EQH/EQL): Engineered Liquidity — why matching swings become engineered magnets instead of support and resistance.
- Liquidity Sweep Explained: The ICT Stop Hunt — how to tell a stop run beyond a swing from a genuine break.
- What Is a Protected Swing High and Low in ICT? — how it connects to protected swing.