Key Points:
- Signal Type: Trend Continuation. A BOS confirms the existing trend is still intact.
- Core Criteria: Requires a full candle body close past a prior swing high or swing low. A wick breaking the level is not a BOS.
- Bullish BOS: Price closes above a prior swing high in an uptrend.
- Bearish BOS: Price closes below a prior swing low in a downtrend.
- Distinction: It is fundamentally different from a Change of Character (CHoCH), which signals a potential trend reversal, not continuation.
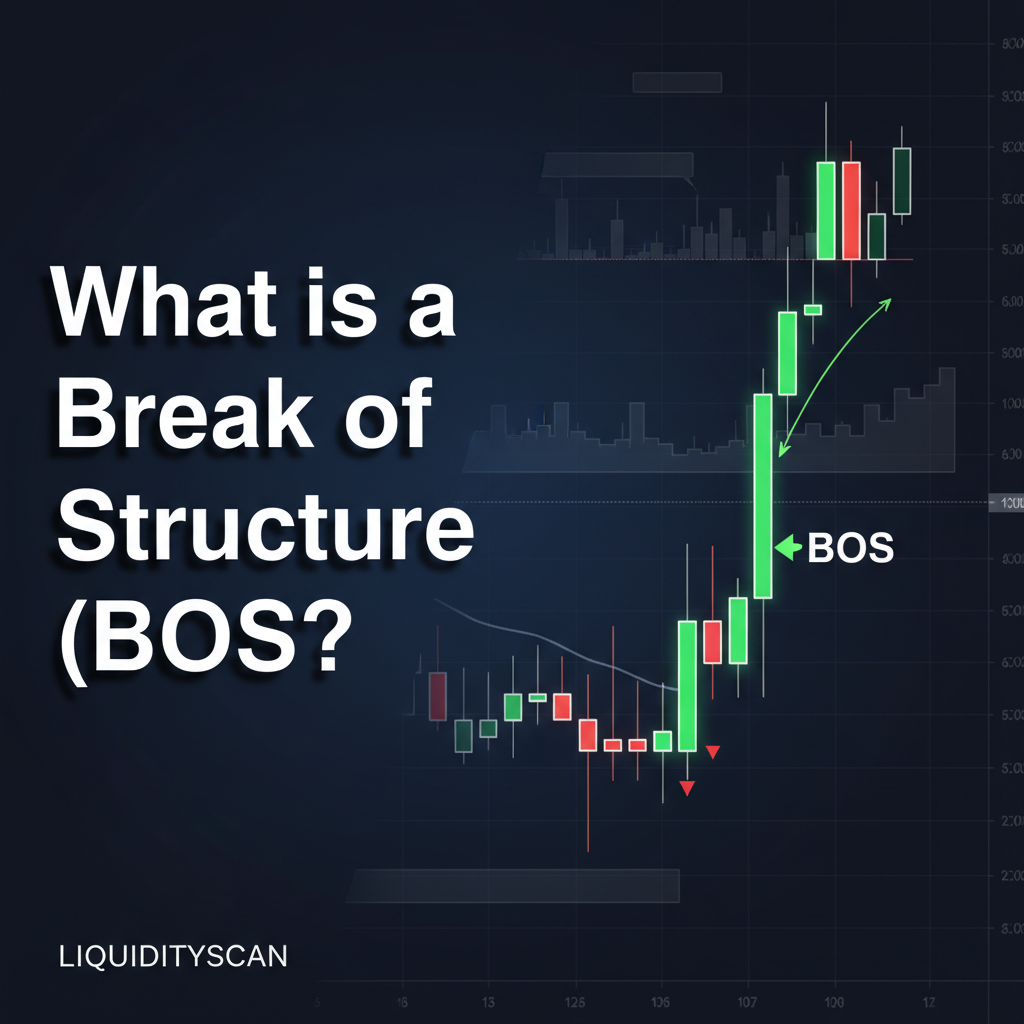
Defining Break of Structure (BOS): The Trend's Confirmation
A Break of Structure is the market's way of showing its hand. In the framework of Inner Circle Trader (ICT) methodologies, price action is a narrative of liquidity and order flow. A BOS is a key chapter in that narrative, signaling that the dominant order flow is strong enough to push through established points of resistance or support. It tells you that the path of least resistance remains in the direction of the current trend.
When you see a valid BOS, it confirms that the swing high or low that was just broken is now a 'weak' point. The 'protected' swing point is on the other side of the trend. For example, in an uptrend, the last swing low is considered the protected low. As long as price respects this low and continues to create a BOS to the upside, the bullish structure is considered valid.
How to Identify a Valid Break of Structure
Identifying a valid BOS requires strict adherence to rules, not subjective interpretation. It begins with correctly marking your swing points on the chart. According to financial exchanges like the CME Group, trend recognition is foundational, and a swing high or low is a primary tool for this. A BOS is the event that validates that recognition.
Bullish BOS: Breaking a Swing High
In a bullish market, price makes a series of higher highs (HH) and higher lows (HL). A bullish BOS occurs when price moves above the most recent higher high.
- Establish the uptrend: Identify a clear pattern of higher highs and higher lows on your chosen timeframe, for instance, the 1H chart on EUR/USD.
- Mark the Swing High: Identify the highest point of the recent pullback, the most recent 'HH'. This is your structural point.
- Wait for the Break: Observe price as it approaches this high. The key is to wait for a 1H candle to close with its body fully above that swing high level.
A simple wick poking above is insufficient. It must be a decisive close, indicating buyers have absorbed all selling pressure at that level and are ready to push higher.
Bearish BOS: Breaking a Swing Low
Conversely, a bearish market creates a series of lower lows (LL) and lower highs (LH). A bearish BOS confirms this downward momentum.
- Establish the downtrend: Find a pattern of lower lows and lower highs.
- Mark the Swing Low: Identify the lowest point before the most recent retracement, the 'LL'.
- Wait for the Break: Wait for a candle to close with its body fully below that swing low. This confirms that sellers are still in firm control.
Confirmation is Key: Displacement and Candle Body Closes
The most common mistake traders make is confusing a BOS with a liquidity sweep. A sweep is just a wick that pierces a previous high or low to grab stop-loss orders before reversing. A true BOS is confirmed by a candle body closing past the level, ideally accompanied by displacement. Displacement refers to a strong, energetic move that often leaves behind inefficiencies like a Fair Value Gap (FVG).
Think of it this way: a wick is an auction that failed. Price went there, but was rejected. A full-body close, however, is a successfully completed auction. It represents agreement and commitment from institutional players to move price to a new range. Without this body close, you do not have a confirmed Break of Structure; you have a potential stop hunt.
BOS vs. CHoCH: Trend Continuation vs. Potential Reversal
A Break of Structure must not be confused with a Change of Character (CHoCH). While both involve breaking a structural point, they signal opposite intentions. A BOS confirms the trend is continuing, whereas a CHoCH is the first warning sign that the trend may be about to reverse.
- BOS: In an uptrend, a BOS breaks the last swing high in the direction of the trend.
- CHoCH: In an uptrend, a CHoCH breaks the last swing low against the direction of the trend.
A CHoCH is the market taking out the first structural point that would invalidate the current trend sequence (e.g., breaking a higher low in an uptrend). A BOS reinforces that sequence. Understanding this difference is critical for framing your market bias correctly.
Applying BOS in a Trading Strategy
A BOS is not an entry signal on its own. It is a confirmation signal that provides context. Once a bullish BOS occurs on a higher timeframe like the 4H, a trader can anticipate a pullback and look for long entries on a lower timeframe, such as the 15M chart.
The strategy is to wait for the confirmation of trend (the BOS), then wait for price to retrace into a discount area (below 50% equilibrium of the move that created the BOS). Within this discount zone, you would look for a point of interest, like a bullish order block or an FVG, to frame a high-probability entry.
Manually tracking these structural points across dozens of markets and timeframes is demanding. This is why automated tools are valuable. The LiquidityScan scanner, for example, can be configured to detect and alert you in real-time when a candle closes past a key structural high or low, effectively automating the detection of a BOS.
Frequently Asked Questions
What is the difference between a BOS and a liquidity sweep?
A Break of Structure (BOS) is confirmed by a candle body closing past a structural point. A liquidity sweep (or stop hunt) is when only the candle's wick goes past the level before price reverses. A BOS confirms trend continuation; a sweep often precedes a reversal.
Can a Break of Structure be just a wick?
No. According to strict ICT/SMC principles, a valid Break of Structure requires a candle to close with its body beyond the prior swing high or low. A wick-only break is considered a failure to displace the level and is typically classified as a liquidity sweep, not a BOS.
What timeframe is best for identifying a BOS?
The concept of a BOS is fractal and applies to all timeframes. However, a BOS on a higher timeframe (like the Daily or 4H) carries significantly more weight and establishes the larger institutional order flow. Traders often use a high-timeframe BOS to establish a directional bias and then use lower-timeframe (1H, 15M) structures for precision entries.