
Defining the Playing Field: External Range Liquidity
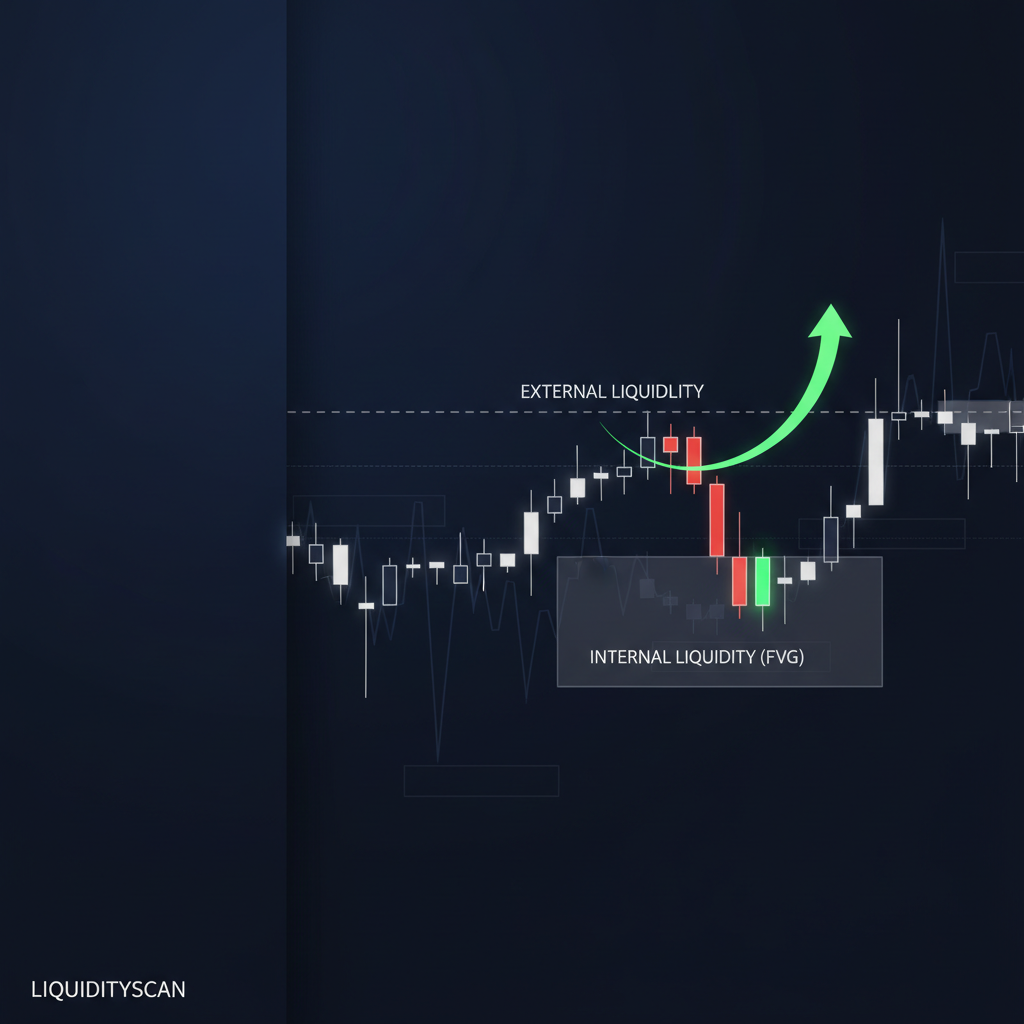
Before you can anticipate the market's next move, you must first define its boundaries. This is the role of external range liquidity. It represents the vast pools of buy-stops and sell-stops that accumulate above old swing highs and below old swing lows. Think of the previous day's high and low, or the prior week's extremes. These are not just lines on a chart; they are magnets for price.
The delivery algorithm engineered by market makers is designed to seek out these dense pockets of orders. Why? To facilitate the execution of their own large positions, a process that requires a counterparty for every transaction. Running the stops of retail traders, breakout traders, and poorly positioned funds provides the necessary fuel. This sweep of external liquidity is often the primary objective of a major price swing.
When you hear an analyst talk about the "draw on liquidity," they are almost always referring to one of these significant external levels. Your first job in any top-down analysis is to identify the current dealing range and mark these highs and lows on your chart. These points define the sandbox that price is currently playing in.
The Repricing Engine: Internal Range Liquidity
A sweep of external liquidity is a climactic event. But what happens next? Price rarely, if ever, moves in a straight line from one external level to the next. It breathes. It retraces. This is where internal range liquidity comes into focus.
Internal liquidity refers to the pockets of inefficiency left behind *within* the established dealing range. These are the footprints of aggressive institutional activity. The most common forms are Fair Value Gaps (FVGs), but the category also includes untouched order blocks, mitigation blocks, and balanced price ranges (BPRs). These areas represent a disequilibrium in the market, where price moved so quickly in one direction that it didn't have time to facilitate efficient, two-sided trade.
The algorithm has a directive to, at some point, return to these areas to reprice them. This rebalancing act serves two purposes: it allows for more efficient market function and it provides institutional players an opportunity to mitigate positions or add to them at more favorable prices. For us, these internal liquidity zones become high-probability points of interest for trade entries. After an external sweep, the pullback to an FVG is often the textbook Optimal Trade Entry (OTE).
The Narrative Cycle: Weaving Internal and External Together
Viewing internal and external liquidity as separate concepts is a mistake. They are two halves of the same story, a continuous cycle that describes the flow of price. Mastering this narrative elevates your trading from pattern recognition to contextual analysis.
The cycle is simple and repeats across all assets and timeframes:
- Consolidation & Range Creation: Price establishes a clear swing high and swing low, defining the boundaries of external liquidity.
- Expansion to External Liquidity: Price moves decisively to attack one side of the range, sweeping the buy-stops above the high or the sell-stops below the low. This can manifest as a sharp stop hunt or a clean Break of Structure (BOS).
- Reversal & Retracement to Internal Liquidity: After achieving its external objective, price reverses. This is the move that traps breakout traders. The purpose of this retracement is to reprice an area of internal liquidity, such as filling a 1H FVG created during the expansion leg.
- Continuation to Opposing External Liquidity: Once the internal liquidity level is respected (price reacts strongly from it), the new objective becomes the opposing external liquidity pool. If the weekly low was just swept, the draw is now likely the weekly high, or at least a significant swing high within the range.
I've backtested this cycle across years of ES data. The highest probability setups for me are almost always born from this sequence—a core model in ICT trading: a clear sweep of external liquidity, followed by a displacement move that creates a new FVG, and then a patient wait for price to return to that FVG during a specific kill zone. It's the market's foundational rhythm.
| Feature | External Liquidity | Internal Liquidity |
|---|---|---|
| Location | Outside the current range (old highs/lows) | Inside the current range |
| Form | Buy-stops & Sell-stops | Fair Value Gaps, Order Blocks, Voids |
| Market Function | The "destination" or primary target | The "reason" for a pullback; rebalancing |
| Trader Action | Identify as the market's primary draw | Identify as high-probability entry zones |
Practical Application and Common Pitfalls
To apply this framework, always start with a top-down approach. Use the Daily or 4H chart to identify your primary dealing range and mark its external liquidity levels. Then, drill down to the 1H or 15m chart to pinpoint the arrays of internal liquidity (FVGs, OBs) within that range. Your trade idea should be based on the narrative: "Price has just swept the daily low (external), so I am looking for a long entry if it retraces to the 1H FVG at $1.2345 (internal)."
This is where tooling provides a critical edge. Manually tracking these levels across multiple pairs is taxing. The LiquidityScan scanner, for instance, can be configured to send an alert the moment a 15m FVG forms after a sweep of a key external level like the Asia session high. This automates the discovery process, allowing you to focus your mental capital on execution.
The most common pitfall is impatience. Traders see the powerful move that sweeps external liquidity and, driven by FOMO, chase it. They buy the top of a stop hunt or sell the bottom of a raid, only to be caught in the sharp reversal as price seeks internal liquidity. The professional waits. The entry isn't the sweep itself; it's the discounted pullback that follows.
This cyclical repricing is not a quirk of retail markets; it's a fundamental element of market microstructure. As explained in educational materials from institutions like the CME Group, the need to balance order books and manage large positions necessitates these seemingly inefficient price swings. The sweep of external stops provides the liquidity, and the retracement to internal imbalances provides the favorable pricing for institutional continuation. By understanding this, you align your strategy with the mechanics of the market itself.
Stop seeing the chart as a collection of random wicks and candles. Start reading it as a story. The plot is always the same: a journey from external to internal liquidity, and back again. Your job is to identify which chapter you're in.