
Key Takeaways
- Algorithmic Premise: ICT trading operates on the principle that market price is not random but is delivered by a central bank algorithm (IPDA) designed to seek liquidity.
- Core Components: The methodology is built on four pillars: Liquidity (internal/external), Market Structure (BOS/CHoCH), Displacement (institutional intent), and Premium/Discount arrays.
- PD Arrays are Key: Concepts like order blocks, fair value gaps (FVGs), and breaker blocks are not just patterns but footprints of institutional order flow that can be systematically identified.
- Time is a Factor: Trading is focused on specific windows of volatility known as Kill Zones (London, New York), where high-probability setups are engineered.
- Systematic Approach: A valid ICT trade involves a sequence: establishing a higher-timeframe bias, identifying a liquidity target, waiting for a liquidity sweep, and confirming entry on a lower-timeframe market structure shift.
- ICT vs. SMC: While related, ICT is the source methodology developed by Michael J. Huddleston. Smart Money Concepts (SMC) are often simplified, sometimes misinterpreted, derivatives. Methodological depth is critical for consistency.
Table of Contents
- The Core Philosophy: Viewing the Market as an Algorithm
- Foundational Pillars of ICT Market Analysis
- The Anatomy of Price Delivery: Key PD Arrays
- Timing and Session Dynamics: The Kill Zone Concept
- Building an ICT Trade Setup: A Sequential Framework
- Entry Models and Risk Management in ICT
- ICT vs. SMC: Distinguishing the Source from the Derivative
- Advanced ICT Concepts for the Professional Trader
- Tools for the Modern ICT Trader
- Frequently Asked Questions
The Core Philosophy: Viewing the Market as an Algorithm
Forget everything you learned about retail trend lines and support/resistance. The central premise of ICT trading is that financial markets, particularly Forex, are not a chaotic mess of millions of participants. Instead, they are a highly controlled environment where price is delivered by an algorithm.
This is where most aspiring traders get lost. They are looking for patterns of human behavior when they should be looking for the instruction set of a machine.
Beyond Retail Patterns: The IPDA Premise
The Inner Circle Trader methodology refers to this engine as the Interbank Price Delivery Algorithm, or IPDA. The concept posits that large market-making banks and institutions don't just participate in the market; they create it. Their immense order flow is managed algorithmically to ensure efficient market function, which, from this perspective, means facilitating business and periodically rebalancing price.
This isn't a conspiracy theory. It's an acknowledgment of market modernization. The Bank for International Settlements (BIS) has extensively documented the electronification of FX markets, noting that algorithmic trading and high-frequency strategies are dominant forces. The IPDA is simply a model to conceptualize the behavior of these dominant, programmatic players.
Price Isn't Random; It's Engineered for Liquidity
If the market is an algorithm, what is its primary directive? To seek liquidity. Every significant price move has one of two goals: to reach for a pool of resting buy-stops or sell-stops (external range liquidity) or to rebalance price within an inefficient move (internal range liquidity).
Your old support and resistance levels? The algorithm sees them as nothing more than pools of orders. That clean, obvious double top that every retail trader is shorting? It's a target. The stops resting just above it are the fuel for the next move. This is the fundamental shift in perspective required to trade these concepts. You stop seeing chart patterns and start seeing liquidity engineering.
From "Smart Money" to Algorithmic Delivery
The term "smart money" is often used, but it can be misleading. It implies a shadowy group of traders out to get you. The ICT perspective is more clinical. It's not personal; it's programmatic. The algorithm is simply executing its function. It's not "hunting your stop" because it knows you exist. It's hunting a large pool of stops at a logical price level, and yours just happens to be there along with thousands of others.
Thinking in terms of algorithmic delivery removes the emotion and paranoia. You're no longer battling a mysterious "they." You're analyzing the predictable behavior of a program designed for a specific purpose. Your job is to align your trades with that program's likely next sequence.
Foundational Pillars of ICT Market Analysis
To analyze the algorithm's behavior, you need a framework. ICT provides one built on four interconnected pillars. Mastering their interplay is the difference between randomly pointing at gaps on a chart and building a practical ICT trading model.
Liquidity: The Fuel of the Market (Internal vs. External)
Everything starts and ends with liquidity. It's the reason price moves. We categorize it into two types:
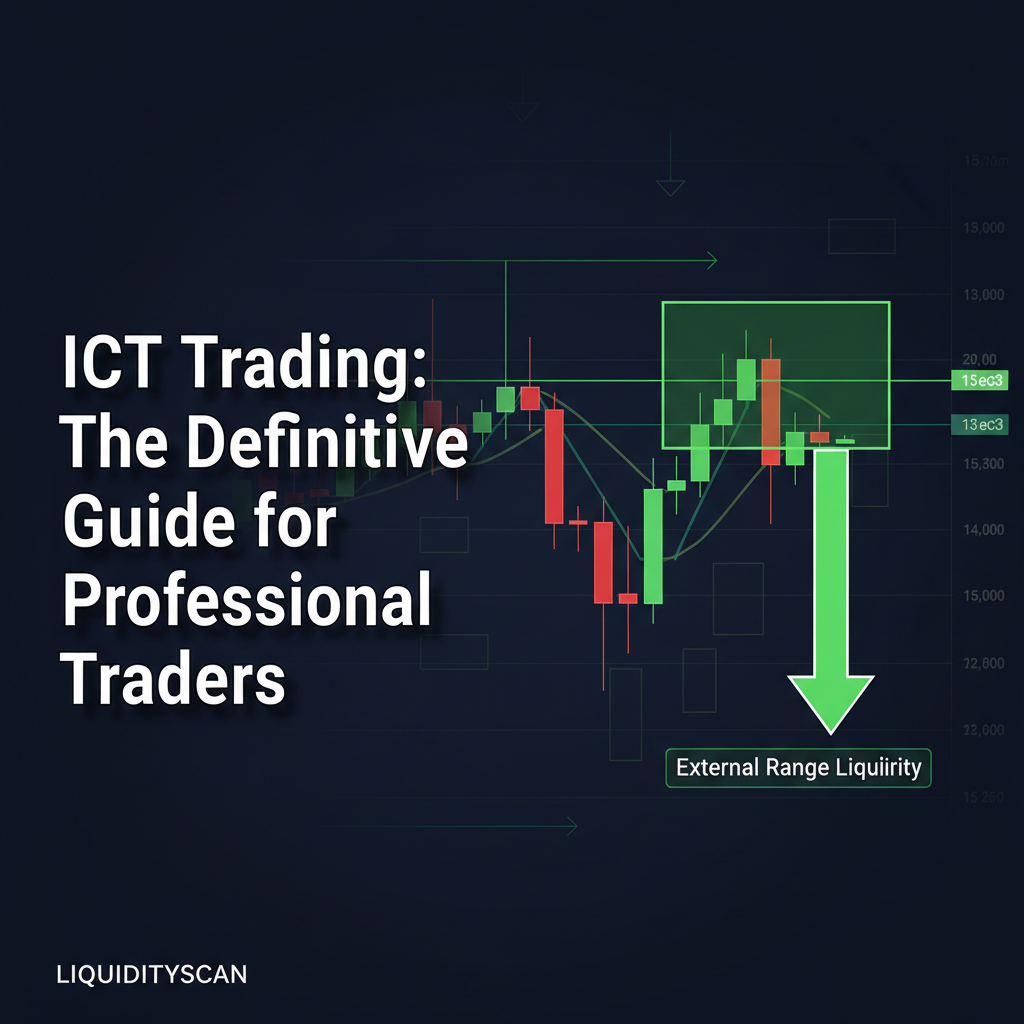
- External Range Liquidity: These are the large pools of orders that accumulate above old highs and below old lows. Think of previous session highs/lows, previous daily/weekly/monthly highs/lows. These are major targets for the algorithm. When price takes out an old high, it's not just a "breakout"; it's a liquidity grab.
- Internal Range Liquidity: This refers to inefficiencies created within a price range. The most prominent example is a fair value gap (FVG). After the algorithm has taken external liquidity, it will often seek to rebalance price by revisiting these internal zones before continuing its campaign toward the next external target.
The constant dance between drawing to external liquidity and then retracing to rebalance internal liquidity is the narrative of price.
Market Structure: The Blueprint (BOS, CHoCH, MSS)
While liquidity is the fuel, the ICT market structure framework provides the blueprint of where price is likely going. In this methodology, structure is defined by swing points created by displacement moves.
- Break of Structure (BOS): In an uptrend, a BOS occurs when price creates a new higher high. In a downtrend, it's a new lower low. This confirms the existing trend is continuing.
- Change of Character (CHoCH) / Market Structure Shift (MSS): This is the first sign that the trend may be changing. For example, in an uptrend (a series of higher highs and higher lows), a CHoCH occurs when price fails to make a higher high and instead breaks below the most recent higher low. This does not guarantee a reversal, but it's a critical alert that the underlying order flow is shifting.
A true market structure shift is not just any wiggle on the chart. It must be validated by displacement. A weak, corrective break of a swing low means nothing.
Displacement: The Signature of Institutional Intent
Displacement is the visual evidence of the algorithm's hand. It's a forceful, energetic move in one direction, characterized by a series of consecutive candles of the same color that often leave behind a fair value gap. It shows a clear willingness to move price away from a certain level with speed and momentum.
When you see a liquidity sweep followed by displacement that causes a market structure shift, you have just witnessed a high-probability reversal signature. This is the footprint of institutional order flow. A move without displacement is suspect; it's likely just a corrective drift and not a true statement of intent.
Premium & Discount: The Fundamental Law of Price
The algorithm is programmed to buy low and sell high. This simple concept is formalized using Fibonacci-style price ranges. For any given trading range (e.g., from a swing low to a swing high), we can divide it into two zones:
- Discount: The lower 50% of the range. The algorithm is biased to buy in this zone.
- Premium: The upper 50% of the range. The algorithm is biased to sell in this zone.
This isn't just arbitrary. It provides a logical framework. Why would you want to be a buyer at the top of a range (in a premium)? You wouldn't. You wait for price to retrace to a discount, find a valid PD array like an order block or FVG, and then look for an entry. This simple filter prevents you from chasing price and forces you to wait for higher-probability setups.
The Anatomy of Price Delivery: Key PD Arrays
Price doesn't move in a vacuum. It moves from one key reference point to the next. In ICT, these reference points are called PD Arrays (Premium/Discount Arrays). They are the specific chart formations that signal where the algorithm is likely to react. Learning to identify them in real-time is a core skill.
Order Blocks (OBs): The Origin of Major Moves
An order block is, in its simplest form, the last down-close candle before a strong up-move (a bullish OB) or the last up-close candle before a strong down-move (a bearish OB). But the definition is more nuanced.
A valid order block should ideally take liquidity (e.g., run a short-term low) and then launch a move with displacement that breaks market structure. When price later returns to this candle, it's expected to act as a powerful support/resistance zone. The algorithm is essentially returning to the origin point of a large order injection to mitigate remaining positions or initiate new ones.
Fair Value Gaps (FVGs): Voids of Inefficiency
A Fair Value Gap (FVG), also known as an imbalance, is a three-candle pattern. It occurs when a single candle moves with such force that the wicks of the candle before it and the candle after it do not overlap its body. This creates a literal gap or void in price delivery.
These gaps represent inefficiency. The algorithm has a tendency to revisit these areas to "rebalance" price and offer it at levels that were skipped during the initial aggressive move. An FVG in a discount zone (for buys) or a premium zone (for shorts) is a high-probability target for a trade entry.
Breaker and Mitigation Blocks: Failed Zones Turned Support/Resistance
These are slightly more complex but powerful concepts. They represent a failure of a previous expectation.
- Breaker Block: Imagine an uptrend. Price makes a high, pulls back to a low, and then goes to make a new higher high. If that attempt fails and price instead collapses, breaking through the previous low, the swing structure between the high and the failed higher-high attempt becomes a Bearish Breaker. When price retraces back to this zone, it's expected to act as strong resistance. The logic is that the orders that were trapped expecting a higher price are now being used to fuel the move lower.
- Mitigation Block: A mitigation block is similar but involves a failure to break a major high or low. It's essentially a failed order block. When a bullish order block fails to hold price and is violated, it can flip and act as resistance when price revisits it. The institutions are "mitigating" their losing long positions by selling at their entry point.
Balanced Price Ranges (BPRs) and Inversions
These are advanced but critical arrays. A Balanced Price Range (BPR) is formed when an up-close FVG and a down-close FVG overlap. This creates an area of intense equilibrium and sensitivity. Price often slices through it cleanly or reacts precisely at its edges.
An Inversion FVG is a powerful concept I watch for constantly. It occurs when a fair value gap that should have acted as support (in an uptrend) fails and is traded through. Once violated, that same FVG flips its polarity and becomes a potent resistance level. Seeing this happen in real-time provides a huge clue about the shift in institutional order flow.
Timing and Session Dynamics: The Kill Zone Concept
Price, liquidity, and structure are only two-thirds of the equation. The third, and arguably most important, element is time. The ICT methodology places extreme importance on trading only during specific windows of the day when volatility is highest and the algorithm is most active. These are the Kill Zones.
The Judas Swing: Engineering Liquidity at the Session Open
This is a hallmark of session opens, particularly the London open. The Judas Swing is a false move designed to trap traders on the wrong side of the market and to sweep liquidity before the real move of the session begins. For example, if the true institutional bias for the London session is bullish, the Judas Swing will often manifest as a sharp move lower right after the open, running the Asian session lows or other nearby sell-stops. This move induces traders to go short, right before the market reverses and begins its true ascent. I've watched this pattern burn aspiring traders more times than I can count. Learning to identify and sit through the Judas Swing is a rite of passage.
London Kill Zone: The Epicenter of Volatility
Typically running from 2:00 AM to 5:00 AM New York time (EST), the London Kill Zone is the primary session for most Forex traders. This is when the daily range is often established. The highest probability setups often form after the Judas Swing has completed its work. The move that takes out the Asian session high or low often happens within this window. If you're trading GBP or EUR pairs, this is your main hunting ground.
New York Kill Zone: Confirmation and Reversals
The NY Kill Zone (roughly 7:00 AM to 10:00 AM EST) has its own distinct personality. It can either continue the move initiated in London, often after a small retracement, or it can stage a full reversal of the London price action. The NY open often provides a secondary Judas Swing of its own. High-impact US news events during this window can act as catalysts for major liquidity sweeps and displacement moves. For indices like ES (S&P 500 futures) and NQ (Nasdaq futures), this is the primary session.
Asian Range: The Setup for London's Narrative
The Asian session is typically a period of consolidation. While setups can occur, its main role in the ICT framework is to create the liquidity that will be targeted in the London session. The high and low of the Asian range become magnets for price. A professional trader watches the Asian session not to trade it, but to understand what liquidity is being built up for the main event in London.
Building an ICT Trade Setup: A Sequential Framework
ICT is not a collection of random signals. It's a top-down, sequential process. You can't just find an FVG on a 5-minute chart and click buy. A valid setup requires a confluence of factors, all aligning to tell the same story. This is the process.
Step 1: Establishing Higher Timeframe Directional Bias
Everything starts on the Daily, Weekly, and 4-hour charts. Where is price likely to go on a macro scale? What is the next major pool of external range liquidity (e.g., last week's high) that the algorithm is reaching for? What is the overall market structure? Are we in a premium or discount of the larger yearly or quarterly range?
This is your anchor. Without a firm higher-timeframe (HTF) bias, you are just gambling on intraday noise. You need to know if you're looking for buys or sells for the day or week. This is what we call establishing the "narrative."
Step 2: Identifying External Range Liquidity Targets
Once you have your HTF bias, you zoom in. On the 4H or 1H chart, you identify the more immediate liquidity pools that align with your bias. If your weekly bias is bullish, you're looking for old highs, session highs, or other pockets of buy-stops that price can target. Conversely, you're also identifying key discount PD arrays below the current price that could support a move higher. This creates a roadmap for the session.
Step 3: Waiting for a Liquidity Sweep in a Kill Zone
This is where patience becomes your greatest asset. You have your bias and your targets. Now you do nothing. You wait for the market to enter a Kill Zone (London or NY). Then, you wait for price to make a clear run on a pool of liquidity. This could be the Asian session low being swept, or a short-term high from the previous day being run.
This liquidity sweep is the catalyst. It's the "manipulation" phase of the Power of Three (Accumulation, Manipulation, Distribution). Without this event, any subsequent setup is less probable.
Step 4: Confirming Entry with a Lower Timeframe Market Structure Shift
After the liquidity sweep, you drop down to a lower timeframe (LTF), like the 15m, 5m, or even 1m chart. You are now looking for the algorithm to show its hand. You want to see a clear Market Structure Shift (MSS) or Change of Character (CHoCH). This means you want to see that liquidity sweep followed by a sharp reversal with displacement that breaks a recent, valid swing point against the direction of the sweep.
This MSS confirms that the liquidity run was indeed a stop hunt and not the beginning of a sustained move. The displacement creates new PD arrays (like an FVG or an order block) on the LTF, which you can then use for a precise entry as price pulls back.
Entry Models and Risk Management in ICT
Once the multi-step framework confirms a potential setup, the focus shifts to execution. ICT provides several specific entry models, but they all revolve around entering on a retracement into a high-probability PD array.
The Optimal Trade Entry (OTE) Pattern
The OTE is a classic ICT entry model. After a major swing, you pull a Fibonacci tool from the swing low to the swing high (for a long) or vice versa (for a short). The OTE zone is the area between the 61.8% and 78.6% retracement levels, with the 70.5% level being the sweet spot.
The ideal OTE entry occurs when this Fibonacci zone aligns with another PD array, such as an order block or a fair value gap. This confluence of factors creates a very high-probability entry point. You are buying at a deep discount (or selling at a deep premium) right where the algorithm is likely to step back in.
The "2022 Mentorship" Model: FVG Entry after a Sweep
This has become one of the most popular and clear-cut entry models. It's a direct application of the sequential framework described earlier.
- Price sweeps a key liquidity pool.
- Price displaces away, creating a Market Structure Shift on a lower timeframe.
- This displacement move leaves a Fair Value Gap (FVG).
- The entry is taken when price retraces back into that FVG.
It's simple, repeatable, and rooted in the core logic of the methodology. I've found this model to be exceptionally robust, especially on pairs like EUR/USD and indices during the NY Kill Zone.
Defining Risk: Placing Stops Above/Below Validated Structure
Risk management in ICT is not arbitrary. Your stop loss has a logical place. If you are taking a long entry based on a bullish market structure shift, your stop loss goes below the swing low that was formed right before the displacement move. That low is now a protected point. If price trades back below it, your entire trade idea is invalidated.
You never place your stop just a few pips away to get a crazy risk-to-reward ratio. You place it where the structure tells you the idea is wrong. This instills discipline and protects you from being stopped out by random noise.
Targeting: From Internal Range Liquidity to External Highs/Lows
Profit targets are also defined by the structure. Your first target might be an internal range liquidity pool, like an FVG at the other end of the LTF move. Your final target should be a significant higher-timeframe pool of external liquidity—the one you identified back in Step 1. This is how you achieve high R:R trades. You enter on a micro-level setup to ride a macro-level objective.
ICT vs. SMC: Distinguishing the Source from the Derivative
As you dive deeper, you'll encounter two terms: ICT and SMC (Smart Money Concepts). It's important to understand the distinction.
Core Differences in Terminology and Application
ICT (Inner Circle Trader) refers to the body of work and specific methodologies developed and taught by Michael J. Huddleston over several decades. It is a comprehensive, and at times esoteric, system with very specific rules, definitions, and a unique lexicon (e.g., IPDA, Silver Bullet, CISD).
SMC (Smart Money Concepts) is a broader, more generalized term that has been popularized on social media. It borrows heavily from ICT's core ideas—order blocks, liquidity, market structure shifts—but often presents them in a simplified, and sometimes incomplete, way. For example, any down-close candle might be labeled an "order block" in SMC circles, whereas a true ICT practitioner would have a much stricter set of criteria for its validity.
| Aspect | ICT (Inner Circle Trader) | SMC (Smart Money Concepts) |
|---|---|---|
| Origin | Michael J. Huddleston's specific mentorships | Generalized, community-driven interpretation |
| Focus | Time, price, algorithmic delivery, specific models | Primarily price patterns (order blocks, CHoCH) |
| Complexity | High; deep, interconnected, and evolving concepts | Lower; often simplified for easier consumption |
| Example | A trade is only valid if it occurs in a Kill Zone, after a Judas Swing, targeting a specific HTF objective. | Find a "CHoCH" and an "order block" and trade. |
The Risk of Over-Simplification in Mainstream SMC
The danger for a developing trader lies in this simplification. SMC can give you the "what" (order blocks, FVGs) without the critical "why" and "when" (HTF bias, Kill Zones, liquidity engineering). This leads to pattern-matching without context, which is a fast track to inconsistent results. You end up seeing "setups" everywhere, but they lack the institutional backing that makes them high probability.
Why Methodological Purity Matters for Consistency
I'm not an ICT purist for the sake of dogma. I'm a purist because I've seen that the concepts work best when applied as an interconnected system. Taking one piece, like the FVG, and ignoring the context of time and liquidity is like trying to bake a cake with only flour. You need all the ingredients in the right proportions. Sticking closer to the source material provides a more robust and logically consistent framework, which is the foundation of building a lasting edge.
Advanced ICT Concepts for the Professional Trader
Once you have a firm grasp on the foundations, you can begin to incorporate more advanced layers of analysis. These concepts add precision and can help you better anticipate market moves.
Intermarket Analysis: Using SMT Divergence
Smart Money Technique (SMT) Divergence is a powerful tool for confirming shifts in market sentiment. It involves comparing two closely correlated assets. The classic example is comparing EUR/USD and GBP/USD against the Dollar Index (DXY). If DXY makes a new higher high, you would expect both EUR/USD and GBP/USD to make new lower lows.
If, however, DXY makes a higher high but EUR/USD fails to make a lower low, this creates a bullish SMT divergence. It's a sign that smart money is accumulating Euros despite dollar strength, tipping you off to a potential reversal. It's a subtle but profound clue about underlying strength or weakness.
Candle Range Theory (CRT): Decoding Intracandle Narratives
Candle Range Theory (CRT) is a more recent development that treats each candle, particularly on higher timeframes like the Daily, as its own self-contained trading range. The theory posits that you can analyze the open, high, low, and close of a single candle using the same ICT principles of premium/discount and liquidity runs.
For example, if a daily candle has a long upper wick, that wick can be viewed as a session that ran liquidity higher before displacing lower to close. The LiquidityScan CRT engine is designed specifically to detect these intra-candle dynamics, flagging candles that show strong institutional rejection or accumulation within their own range.
The Power of Three: Accumulation, Manipulation, Distribution
This is a macro-level concept that frames price action within a given period (like a day or week). It's also known as the AMD cycle.
- Accumulation: A period of range-bound price action where large institutions are building their positions without moving the market significantly. This often corresponds with the Asian session.
- Manipulation: A false move to engineer liquidity. This is the Judas Swing that runs stops above or below the accumulation range.
- Distribution: The true, sustained move of the session, where institutions distribute their positions at more favorable prices. This is the trend you want to catch.
Viewing the daily cycle through this lens helps you contextualize session movements and avoid getting caught in the manipulation phase.
Change in the State of Delivery (CISD)
This is a top-tier concept. A CISD is a market structure shift on a higher timeframe. While a CHoCH or MSS might happen on a 5-minute chart, a CISD is when, for example, a bullish order block on the Daily chart is violated. It signifies a major Change in the State of Delivery from bullish to bearish (or vice versa).
When you see a bearish CISD (a bullish PD array fails) followed by a bullish CISD (a bearish PD array subsequently fails), it indicates extreme uncertainty and a potential consolidation period. When you see a CISD confirm a new direction, it can signal the start of a multi-week or multi-month trend. Our platform's CISD detector tracks these major inflection points on higher timeframes, providing a macro-level compass.
Tools for the Modern ICT Trader
While ICT is a discretionary methodology, the right tools can significantly enhance your efficiency and effectiveness. The goal isn't to automate your decisions, but to automate your analysis so you can focus on high-quality execution.
Charting Platforms and Custom Indicators
TradingView is the platform of choice for most ICT traders due to its clean interface and powerful scripting language, Pine Script. There are thousands of community-built indicators that can automatically draw FVGs, order blocks, and session ranges. While helpful for training your eye, be cautious. Many are poorly coded and don't adhere to the strict definitions of the methodology. Use them as a guide, not as a definitive signal.
The Role of Real-Time Scanners (like LiquidityScan)
This is where a professional trader gains a significant edge. Instead of manually flipping through dozens of charts looking for the right conditions, a real-time scanner does the heavy lifting. For example, the LiquidityScan Scanner monitors hundreds of markets simultaneously.
You can set up an alert to notify you the moment a 1H FVG forms on EUR/USD during the London Kill Zone after a sweep of the Asian low. This frees you from hours of screen time, prevents fatigue, and ensures you never miss a potential A+ setup. It turns a subjective search into a systematic, data-driven process. The tool doesn't make the decision; it presents you with a filtered, high-probability candidate for your expert review.
Tools like our Core Layer also provide institutional bias readings, overlaying a quantitative layer on top of the discretionary chart analysis, helping to confirm your HTF narrative.
Backtesting and Journaling: The Data-Driven Edge
Your trading must be based on data, not hope. Rigorous backtesting is non-negotiable. Go back on your charts and manually mark up every single setup that meets your criteria for a given month. What was the win rate? What was the average R:R? Did setups in the NY session perform better than London? This is how you build confidence and refine your model.
A detailed journal is equally important. Screenshot every trade—win or lose. Note your emotional state, the rationale for entry, and what you could have done better. This is how you identify your personal weaknesses and turn them into strengths. There is no substitute for this work. None.
Frequently Asked Questions
- Is ICT trading profitable?
- Yes, for those who treat it as a professional discipline. It is not a get-rich-quick scheme. Profitability comes from deep study, rigorous backtesting, disciplined execution, and psychological fortitude. Many traders fail because they are looking for easy signals, not a comprehensive market framework.
- How long does it take to learn ICT?
- There's no set timeline. I've seen dedicated individuals become competent within 12 to 18 months of intense, full-time study and practice. For most, it's a multi-year journey to mastery. The concepts appear simple, but learning to apply them in a live market with real-time pressure is a different challenge entirely.
- Is ICT the same as Wyckoff?
- They are philosophical cousins but not identical twins. Both Wyckoff and ICT view the market as being driven by large, composite operators. Wyckoff uses terms like Accumulation, Distribution, Springs, and Upthrusts. ICT uses Power of Three, Judas Swings, and Liquidity Sweeps. ICT is arguably a more modern and granular application of the same core principles, tailored for today's algorithmic markets.
- Can ICT be used for crypto and stocks?
- Absolutely. The principles of liquidity engineering and algorithmic price delivery apply to any market with a centralized order book and sufficient liquidity. I've found ICT concepts to be extremely effective on major cryptocurrencies like Bitcoin (BTC) and Ethereum (ETH), as well as stock indices like the S&P 500 (ES) and Nasdaq 100 (NQ).
- What is the best timeframe for ICT?
- ICT is a multi-timeframe methodology, not a strategy for a single timeframe. Analysis starts on the Weekly/Daily for bias, moves to the 4H/1H for the narrative and PD arrays, and finishes on the 15m/5m/1m for execution. There is no "best" timeframe, only the right timeframe for each stage of the analysis.
- Do you need to watch all of Michael's videos?
- Michael Huddleston has produced an enormous amount of content over the years. While it's the source material, it can be overwhelming and sometimes contradictory as his own understanding evolved. A structured approach, like focusing on one mentorship year (e.g., the 2022 Mentorship) and mastering its model first, is often more effective than trying to consume everything at once.