
What Makes a Good Fair Value Gap Scanner?
A good fair value gap scanner does not just plot every three-candle imbalance. It grades each gap by higher-timeframe nesting, tracks whether the gap is still untouched, confirms real displacement, and never repaints — leaving a short list of quality zones, not a wall of noise.
The distinction matters because a Fair Value Gap (FVG) is one of the few ICT concepts a machine can detect perfectly. A gap either exists between candle one and candle three or it does not; there is no discretionary judgment in the geometry.
That objectivity is exactly why FVGs are the ideal target for automation — and also why the market is full of naive scanners that detect gaps flawlessly and rank them not at all.
This guide lays out the criteria that separate a scanner worth trading from a plotting toy, the failure modes to watch for, and how LiquidityScan's engine implements them. The goal is a buyer's framework you can hold any tool against, including ours.
Why Fair Value Gaps Are Ideal for Scanning
Most ICT concepts resist automation because they require reading intent. An Order Block needs you to decide which opposing candle really launched the move; a liquidity pool needs a judgment call on which highs count as "equal." The fair value gap has no such ambiguity.
The definition is purely mechanical. In a bullish gap, you compare candle one's high to candle three's low: if candle three's low sits above candle one's high, the untraded band between them is the FVG. The bearish mirror compares candle one's low to candle three's high.
A computer evaluates that on every rolling three-candle window across hundreds of symbols and every timeframe in milliseconds, with zero interpretation.
That perfect detectability is a double-edged sword. Because gaps are trivial to find, the hard problem shifts entirely to filtering and grading. Liquid markets print dozens of gaps per symbol per day; the overwhelming majority are noise — small imbalances inside chop that carry no institutional footprint.
A scanner that surfaces all of them has technically "found the FVGs" while giving you nothing actionable. The value is not detection. The value is judgment about which detected gaps deserve attention.
The Six Criteria of a Serious FVG Scanner
Use these six criteria to judge any fair value gap scanner. Each one attacks a specific way naive tools fail, and together they define the gap between a plotting overlay and a decision engine.
1. Multi-timeframe nesting and grading
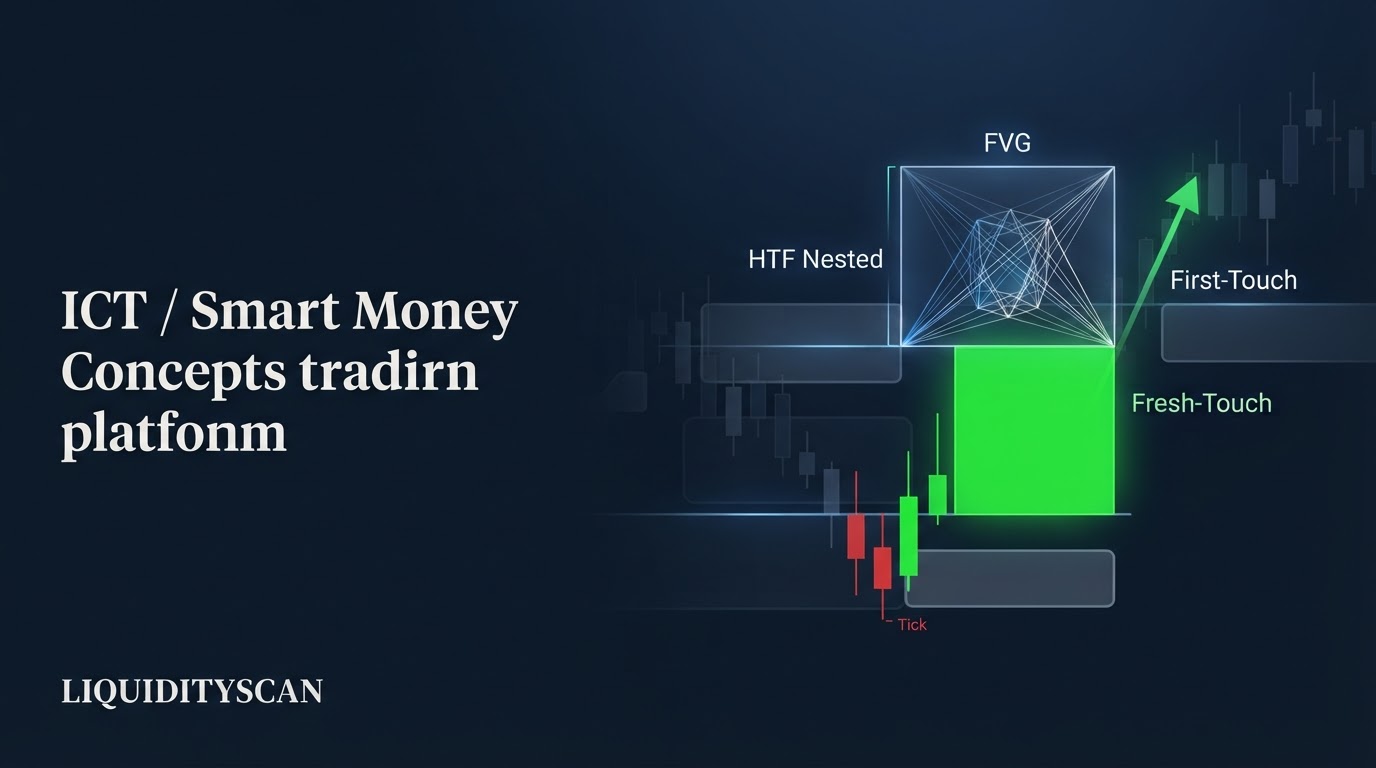
The single most important filter. Not all gaps are equal: a 5-minute FVG that sits inside a 4-hour FVG, which itself sits inside a daily FVG, is a far higher-quality zone than a lone 5-minute gap floating in isolation.
The nested gap marks a price where inefficiency exists on multiple timeframes at once, meaning multiple classes of participant have unfinished business there. A serious scanner does not just detect the gap — it checks how it nests inside higher-timeframe gaps and assigns a quality grade based on that alignment.
2. First-touch freshness tracking
An FVG delivers its edge on the first return, when the untouched imbalance still holds unfilled orders. Once price has already tapped the gap, the residual is smaller and the reaction is weaker; a second or third test is usually a breach in progress.
A scanner that keeps alerting on a gap price already traded through is selling you a stale signal. Freshness — has this gap been mitigated yet — must be tracked and enforced, not ignored.
3. Displacement context
A real FVG is carved by displacement — a fast, body-dominant expansion that signals urgency and usually breaks structure. A gap left by slow, wicky, overlapping drift is just a pause in two-sided trade and means nothing.
A good scanner weighs the character of the move that created the gap, favoring gaps born from outsized expansion candles over cosmetic three-candle patterns in noise.
4. Multi-symbol coverage
A gap is only useful if you are watching when it forms. Manually flipping through charts, you will see a handful of symbols. A scanner earns its keep by watching the whole universe — crypto, forex, indices — across every timeframe simultaneously, so the fresh, well-graded gap on a pair you were not looking at still reaches you.
5. Pre-arrival alerts
The best time to know about a gap is before price fills it, while there is still an entry to plan and a stop to place. A scanner that only tells you a gap was tapped after the reaction has already happened is a historian.
One that surfaces a fresh, graded gap as a standing zone — so you are ready as price approaches — is a tool you can actually trade from.
6. No repaint
This is non-negotiable. A repainting scanner redraws gaps on historical bars so its charts look flawless in hindsight while its live alerts were never that clean.
The detection logic must be anchored to closed candles, and a gap that was flagged must stay flagged at the price it was flagged — no retroactive relocation. If you cannot trust that a backtested screenshot reflects what the tool did live, you cannot trust the tool.
How Naive Fair Value Gap Scanners Fail
Set those six criteria against the typical free indicator and the gaps line up predictably. A naive FVG scanner fails in four recurring ways, and recognizing them protects you from mistaking activity for signal.
- It plots every three-candle gap. With no minimum size, displacement, or context filter, the chart fills with dozens of trivial imbalances. Signal and noise get the same box, so you are back to manual judgment — the scanner saved you nothing.
- It ignores freshness. The tool keeps drawing a gap and firing alerts long after price traded clean through it. You get pinged on a level whose edge was spent hours or days ago, with no flag that it has already been mitigated.
- It has no concept of nesting. A lone 1-minute gap in chop is rendered identically to a 1-minute gap nested inside daily and 4-hour imbalance. Without grading, the highest-value zones are invisible inside the crowd — the one piece of analysis that actually separates good gaps from bad is simply absent.
- It repaints. Because detection runs on the forming candle rather than the closed one, gaps appear and vanish as bars complete. The hindsight chart looks perfect; the live experience is boxes that move. Any performance you infer from the historical view is fiction.
None of these are exotic bugs. They are the default behavior of a tool built to detect geometry and stop there. The work a serious scanner does — filtering, grading, freshness, integrity — is invisible on a screenshot, which is exactly why it is so often skipped.
How LiquidityScan's FVG Scanner Works
LiquidityScan's fair value gap scanner is built around the criteria above rather than raw detection. Three design choices carry most of the weight.
Multi-timeframe nesting drives the grade. Every detected gap is evaluated for how it nests inside higher-timeframe FVGs, and that nesting determines a quality tier — STARTER, BASE, or PRO. A gap that stands alone on a low timeframe grades lower; a gap confirmed by overlapping imbalance on higher timeframes climbs the tiers.
The grade is the scanner's answer to "which of these dozens of gaps actually matters," and it is the feature that most distinguishes it from a plotting overlay.
First-touch freshness is required, not optional. The engine tracks mitigation and treats first-touch freshness as a condition for surfacing a gap. A gap that price has already tapped is not presented as a live opportunity. That single rule removes the largest category of stale-signal noise that plagues naive tools.
It runs on live candle data. Grading and freshness are evaluated against live market data across the tracked universe, so a fresh, well-nested gap on a symbol you were not personally watching still reaches you as a standing zone.
One implementation note for expectation-setting: very short-timeframe, sub-hour gaps are maintained in the scanner's store rather than surfaced the same way as higher-timeframe zones — a deliberate choice, because sub-hour gaps are abundant and noisy, and the higher-timeframe grades are where the durable edge lives.
The honest framing: this makes LiquidityScan a strong tool for finding and ranking fresh, high-quality gaps automatically. It does not make the gaps trade themselves — which is the whole point of the next section.
How to Use a Scanned Fair Value Gap Properly
A scanner finds; you judge. The correct division of labor is that the fair value gap scanner surfaces a fresh, graded zone, and you supply the context the machine cannot: directional bias, location in the range, and risk. Walk the flow from alert to decision.
- The scanner surfaces the zone. Say it flags a fresh, PRO-grade bullish FVG on BTCUSDT 1H between 116,150 and 116,600, nested inside a 4H gap, born from an expansion candle after a sweep of sell-side liquidity. That is your candidate — pre-arrival, price has not filled it yet.
- You check the higher-timeframe draw. Is the daily Draw on Liquidity above, supporting a long back into the gap, or is the higher-timeframe pointing down, making this a countertrend tap to fade? The scanner does not know your bias; you set it. If the draw opposes the gap, you pass.
- You check premium/discount. A bullish gap you want to buy should sit in the discount half of the dealing range. A demand zone in premium is fighting its own math. This is a manual check against your marked range.
- You enter with a defined stop. If bias and location agree, you plan the entry — often at Consequent Encroachment, the 50% midpoint of the gap around 116,375 — with the stop just beyond the far edge near 116,080, sized to your risk. The scanner gave you the zone; you defined the trade.
Here is the honest limitation, stated plainly: a detected FVG is a zone of interest, not a guaranteed reversal. The scanner is telling you "here is a fresh, high-quality imbalance price may rebalance," not "price will turn here."
Gaps get filled and keep going; strong trends blow through beautifully graded zones. If a gap is illustrative of anything, treat fill behavior as a tendency to rebalance inefficiency, not a probability you can bank — and verify how any zone type behaves on your own market and timeframe before you size up.
The tool sharpens where you look. It does not remove the need to be right about direction.
Fair Value Gap Scanner Criteria Checklist
Hold any fair value gap scanner against this table before you trust it. A tool that misses the bottom rows is a plotting overlay; one that covers them is a decision engine.
| Criterion | Naive FVG Scanner | Serious FVG Scanner |
|---|---|---|
| Detection | Plots every three-candle gap | Plots gaps, then filters and grades them |
| Quality grading | None — all gaps look equal | Multi-timeframe nesting sets a tier |
| Freshness | Alerts on already-tapped gaps | First-touch freshness required |
| Displacement context | Ignored — noise and impulse alike | Weighs the move that carved the gap |
| Coverage | One chart at a time | Whole symbol universe, all timeframes |
| Alert timing | After the fill (historian) | Pre-arrival, as a standing zone |
| Chart integrity | Repaints on forming candles | No repaint — anchored to closed bars |
Frequently Asked Questions
Can a fair value gap scanner be fully automated?
The detection can, because FVG geometry is objective — a three-candle imbalance either exists or it does not. Grading by nesting, freshness, and displacement can be automated too. What cannot be automated is directional bias and whether the gap fits your trade context, which is why the best workflow is scanner-finds, trader-judges rather than a hands-off signal.
What timeframe should an FVG scanner watch?
All of them, but weight the higher ones. Sub-hour gaps are abundant and noisy, so they add little as standalone signals; 15-minute, 1-hour, 4-hour and daily gaps carry the durable edge. The strongest zones are low-timeframe gaps nested inside higher-timeframe gaps, so a scanner needs multi-timeframe vision to grade quality at all.
Do all scanned fair value gaps get filled?
Most gaps on liquid markets fill eventually, but eventual fill is not an edge — a gap can fill days later, long after any entry made sense. Some gaps in strong trends never fill at all. Trade the reaction at a fresh, well-graded gap, not the statistic that gaps tend to fill, and treat any fill figure as illustrative.
Why does repainting matter so much for FVG tools?
A repainting scanner redraws gaps on historical bars, so its screenshots look flawless while its live alerts never were. If detection runs on the forming candle instead of the closed one, boxes appear and vanish as bars complete. You cannot judge or trust a tool whose historical view does not match what it did in real time.
Related query paths
Start with what an FVG actually is, then go deeper into the mechanics a good scanner grades on, and finish with how to trade the zones it surfaces.
- What Is a Fair Value Gap (FVG)? — the full definition and three-candle anatomy every scanner detects.
- Displacement in ICT: Reading Institutional Intent — why the move that carves a gap decides whether it is signal or noise.
- Consequent Encroachment: The 50% FVG Rule — the midpoint entry level you use once a scanned gap is in play.
- FVG Entry Strategy: A Precision Guide for ICT Traders — the full execution playbook for trading a surfaced gap.
- Validating FVG with Order Flow: A Professional's Guide — adding order-flow confirmation on top of a scanner's grade.
- FVG Fill Probability: What Backtests Reveal About Win Rates — an honest look at the evidence behind gap fills.
- LiquidityScan Pricing & Plans Explained: Free, Starter, and Pro — how it connects to liquidityscan vs tradingview indicators.