
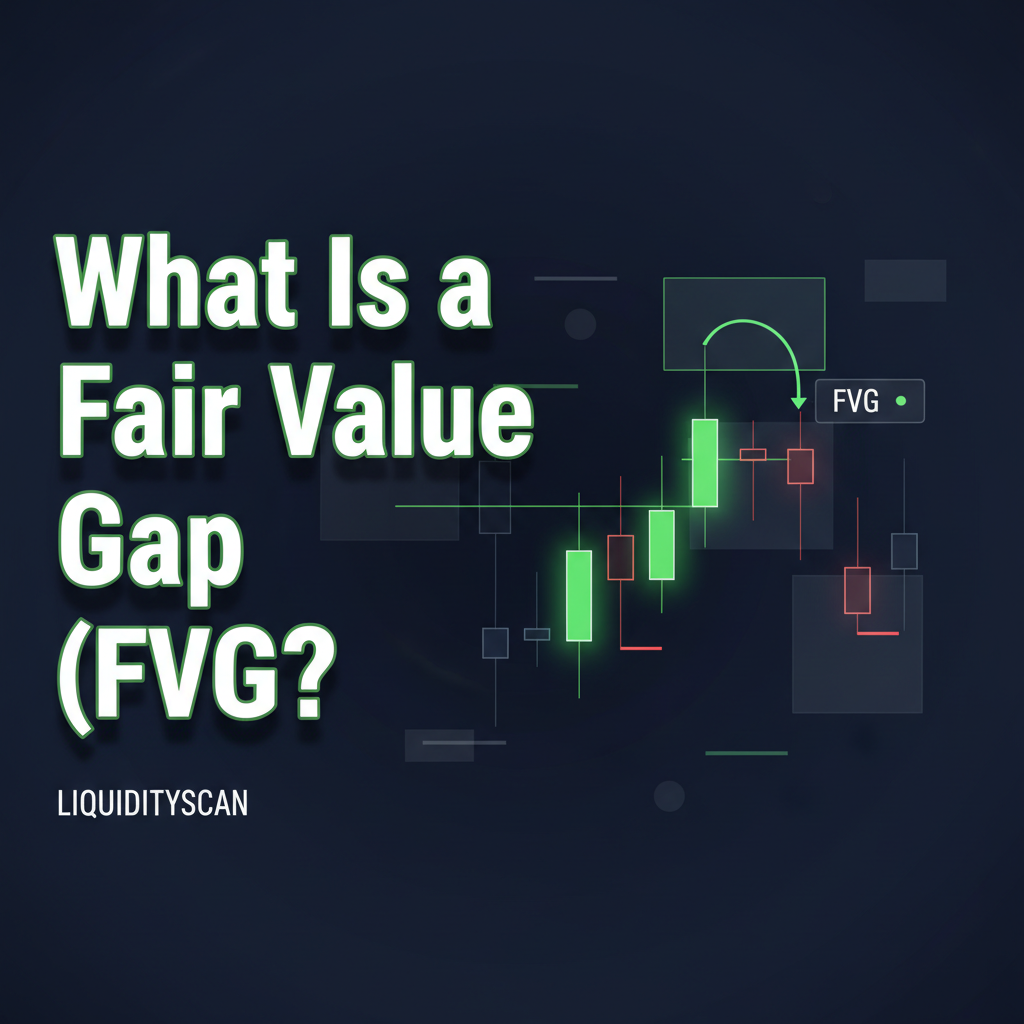
A Fair Value Gap (FVG) is a three-candle price pattern indicating an inefficiency in price delivery. It represents a zone where institutional orders were pushed through aggressively.
Put simply, it's the gap left behind when price moves so fast that one side of the market — buyers or sellers — completely takes over, leaving part of the range untraded. Those untested pockets tend to act like magnets later on, because the market keeps coming back to rebalance and "fill" the inefficiency it skipped.
Key Points
- Three-Candle Pattern: An FVG is defined by the space between the first candle's wick and the third candle's wick.
- Sign of Displacement: It signals aggressive, one-sided participation, often from institutional players. This is known as displacement.
- Price Magnet: FVGs act as a draw on liquidity. Price will often revisit these zones to mitigate orders and rebalance the price ladder.
- Context is Everything: Not all FVGs are created equal. Their significance increases dramatically when they appear in premium or discount zones or cause a break of structure (BOS).
How to Identify a Fair Value Gap
Spotting an FVG is purely mechanical once the structure clicks. There are two flavors: bullish and bearish.
A Bullish FVG (also called a BISI, or Buyside Imbalance Sellside Inefficiency) is formed by three consecutive candles during a strong upward move:
- Candle 1: The high of this candle establishes the bottom of the gap.
- Candle 2: A strong bullish candle that moves aggressively upward.
- Candle 3: The low of this candle establishes the top of the gap.
The FVG is the space between the high of Candle 1 and the low of Candle 3. Notice that the wicks of those two candles never overlap — that empty band is the gap.
A Bearish FVG (also called a SIBI, or Sellside Imbalance Buyside Inefficiency) is the mirror image, formed during a strong downward move:
- Candle 1: The low of this candle establishes the top of the gap.
- Candle 2: A strong bearish candle that moves aggressively downward.
- Candle 3: The high of this candle establishes the bottom of the gap.
Here the FVG sits between the low of Candle 1 and the high of Candle 3, and again the wicks leave a clean, unoverlapped space.
This idea of price inefficiency didn't start with ICT. Traditional exchanges like the CME Group define gaps by session breaks; an FVG is just the fractal, intraday version of the same thing, usually carved out by the high-speed algorithms that run modern markets.
When a Fair Value Gap Matters in Practice
On its own, an FVG is just a shape on the chart. The edge comes from where it sits in the broader market structure.
The FVGs worth trading are the ones left by a move that actually accomplished something. Say a sharp down-move both prints a bearish FVG and takes out a key structural low (a BOS). Now that gap is no longer just a gap — it's a high-probability point of interest for a short if price retraces back into it.
I've also found that FVGs formed right after a liquidity sweep punch well above their weight. A textbook example: GBP/USD in the London session, where a sweep of the Asian highs is followed by a sharp reversal that leaves a bearish FVG behind. That gap is the fingerprint of the aggressive selling that hit right after the stop hunt.
An FVG matters even more when it's part of the move that builds a valid order block. The gap confirms the imbalance that gives the order block its teeth, and when price comes back to mitigate that block, it usually trades into the FVG first. (If you want to pressure-test a gap before you commit, reading the order flow inside it tells you whether it's likely to hold.)
Tracking these confluences by hand across dozens of pairs and timeframes simply doesn't scale. That's where automation stops being a luxury and becomes part of the workflow. The LiquidityScan platform, for example, lets you build custom alerts that only fire when an FVG forms alongside another key event — like our proprietary CISD (Change in State of Delivery) pattern — so the noise gets filtered out and only the real institutional footprints reach you.