
What Is a Volume Imbalance in ICT Trading?
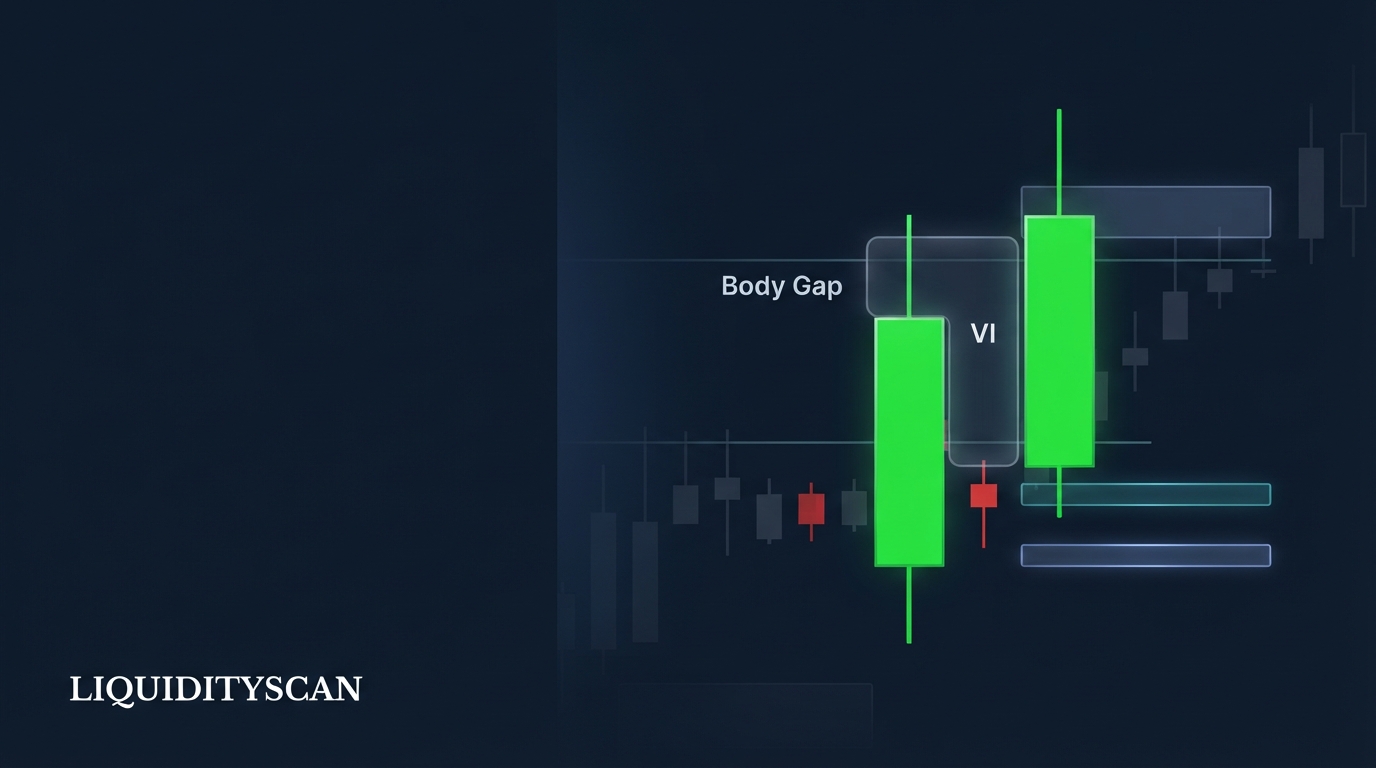
A volume imbalance is a gap between the bodies of two consecutive candles whose wicks still overlap. Price technically traded through that range, but only in wicks, on thin one-directional volume, so ICT treats it as inefficient delivery the algorithm tends to revisit.
The mechanics are simple. In a bullish volume imbalance, candle one closes at, say, 64,180 and candle two opens higher at 64,240. The two candle bodies never touch. But candle one's upper wick and candle two's lower wick overlap somewhere inside that 60-point window, so no true gap exists on the chart. The market printed prices there; it just never auctioned them properly.
That wick overlap is the defining detail. Trade did occur in the range, but it was a fast, one-pass sweep, not a two-way auction. In Inner Circle Trader (ICT) terms, price offered only one side of the market in that window: buyside without sellside, or the reverse. Efficient delivery requires both sides to be offered, and here they were not.
Because the range was delivered inefficiently, it becomes an algorithmic reference point. Price frequently returns later to re-deliver through the body gap, trading it in the opposite direction to rebalance the range before continuing toward its target. That repeatable behavior is what makes the volume imbalance a tradable object rather than candlestick trivia.
Volume Imbalance vs Fair Value Gap vs Opening Gaps
Three ICT inefficiencies get confused constantly because all three are called gaps. They differ in what exactly failed to trade, and that difference drives how price treats each one on the return visit.
A Fair Value Gap (FVG) is a wick-to-wick void across three candles where nothing traded at all. Opening gaps, the New Week Opening Gap (NWOG) and New Day Opening Gap (NDOG), are voids between sessions where the market was not even open. The volume imbalance sits below both: something traded there, just not enough.
| Feature | Volume Imbalance (VI) | Fair Value Gap (FVG) | Opening Gap (NWOG/NDOG) |
|---|---|---|---|
| Candles involved | 2 consecutive candles | 3-candle sequence | Two sessions (prior close vs new open) |
| What is separated | Candle bodies only; wicks still overlap | Candle 1 and candle 3 wick extremes; a full price void | Friday/daily close and the next open; a full void |
| Did price trade in the gap? | Yes, but only in wicks, thin and one-sided | No trade at all inside the gap | No trade at all; the market was closed |
| How to mark it | First candle's body close to second candle's body open | Candle 1 wick extreme to candle 3 wick extreme | Prior session close to new session open |
| Typical retest behavior | Price re-delivers through it, often fills it completely, then resumes | Partial fill to the 50% midpoint often suffices | Persistent magnet; ICT tracks the last several NWOGs as standing reference levels |
| Degree of inefficiency | Thinnest; some wick trade occurred | True intra-session void | Truest void; zero trade by definition |
The useful mental model is a hierarchy of inefficiency. An opening gap is a literal hole in the traded record. An FVG is a hole punched inside a live session. A volume imbalance is not a hole at all, just a stretch of prices the market brushed with wicks instead of auctioning with bodies.
Less void means less unfinished business, which is why a VI on its own carries less gravitational weight than an FVG at the same price, and why VIs matter most when they cluster with other PD arrays rather than standing alone.
How to Mark a Volume Imbalance on Your Chart
Marking a volume imbalance takes three checks. Get any of them wrong and you have labeled a different object with different retest behavior.
Step 1: Find two consecutive candles whose bodies do not overlap
Scan the leg you care about, usually a fast directional move, and look for a pair of candles where the second body opens beyond the first body's close. Bullish case: candle two's open sits above candle one's close. Bearish case: candle two's open sits below it. Body color does not matter; only the open and close levels do.
Step 2: Draw the zone from body close to body open
The volume imbalance is the rectangle between candle one's close and candle two's open. Not wick to wick, not high to low. Body close to body open. Extend it right in time, because the level stays relevant until price trades back through it.
Step 3: Verify the wicks overlap
Confirm that candle one's wick and candle two's wick share at least some price territory inside the zone. If they do not, there is a true void on the chart and you are looking at an actual gap, which behaves like an opening gap, not a VI. This single check is what separates the two classifications.
On the retest, expect transit, not rejection. A volume imbalance holds almost no resting liquidity inside it, because no real auction ever happened there. So when price returns, it typically touches the near edge, slides through the thin interior quickly, and only finds business again at the far edge, where candle bodies and genuine two-way trade resume.
Entries at the far boundary or at the midpoint, the same logic ICT applies to Consequent Encroachment on FVGs, are structurally sounder than entries at the near edge.
Volume Imbalances Inside Displacement Legs
Displacement is the energetic, one-sided move that follows institutional order flow entering the market. Volume imbalances are one of its fingerprints. Bodies can only gap apart when a candle closes near its extreme and the next one opens and runs without hesitation. Passive drift does not print that; urgency does.
That is why a displacement leg littered with volume imbalances and FVGs is graded higher than an equally tall leg without them. The gaps are physical evidence that price moved faster than two-way business could form, which is the definition of institutional intent. If a supposed displacement leg contains zero body gaps and zero wick voids, question whether it was displacement at all or just grind.
Consecutive VIs also give you a map for what happens next. When price retraces into the leg, it tends to walk gap to gap: re-deliver through the nearest volume imbalance, pause at the bodies beyond it, then reach for the next one.
ICT treats a stack of unfilled VIs as a ladder of delivery targets, each an objective the algorithm works through on the way to the larger Draw on Liquidity. The same reading applies with the trend: unfilled imbalances left overhead by an old leg are natural interim targets for the current one.
The practical filter is confluence. A volume imbalance that overlaps an FVG, sits inside an Order Block, or completes a Balanced Price Range (BPR) is a materially different proposition from a lone body gap in chop.
Scanners that grade gaps by displacement quality and multi-timeframe nesting, which is what LiquidityScan's FVG engine does, exist precisely to separate that handful of meaningful imbalances from the dozens each session prints.
Worked Example: A Bullish Volume Imbalance on BTCUSDT
BTCUSDT, 15-minute chart. Price has been resting on equal lows at 64,000 and dips to 63,950, sweeping the sell-side liquidity beneath them. The reaction is immediate displacement higher.
Candle A opens at 64,020, closes at 64,180, with a high at 64,220. Candle B opens at 64,240, prints a low of 64,200, and closes at 64,410. Run the checks: the bodies gap from 64,180 to 64,240, and the wicks overlap between 64,200 and 64,220. Bodies apart, wicks touching.
That is a bullish volume imbalance spanning 64,180 to 64,240, born inside a displacement leg that just took liquidity. The leg extends to 64,650 and leaves a separate FVG above 64,450 for good measure.
Two hours later, price retraces. It touches 64,240, the near edge of the VI, and does not bounce; it slides straight through the thin interior and stalls at 64,178, two points beyond the far edge at 64,180, dipping into Candle A's body where real auction last existed. That is the full re-delivery.
Buyers step back in and price runs to the equal highs at 64,800, the obvious draw above.
The trade plan writes itself from the geometry: resting order at the far edge near 64,185 or at the 64,210 midpoint, stop below the displacement origin at 63,950, target the buy-side at 64,800.
Invalidation is equally mechanical. A full-bodied 15-minute close below the VI's lower boundary that also erases the displacement origin means the re-delivery became a reversal, and the long idea is dead regardless of how clean the gap looked.
The Other Volume Imbalance: Footprint Diagonal Imbalances
One clarification saves a lot of confused searching: the order-flow community uses the exact same term for a completely different object. On a footprint chart, a volume imbalance means a diagonal imbalance, executed ask volume at one price compared against executed bid volume one tick lower. The comparison is diagonal because aggressive buyers lift the offer at the next price up.
When the ratio clears a threshold, commonly 300% or 3:1, that cell is flagged. Three or more stacked imbalances mark a level of one-sided aggression that footprint traders treat as support or resistance.
That concept measures actual executed volume and requires bid/ask trade data. The ICT volume imbalance measures nothing of the sort. Despite the name, it is pure candle geometry, bodies gapping while wicks overlap, and the word volume refers to the inferred thinness of participation, not a reading from a volume feed.
That is also why the ICT version works identically on spot forex, which has no centralized volume, and on crypto perpetuals, which do.
The two are not interchangeable, but they are not enemies either. Some traders use stacked footprint imbalances as independent confirmation that an ICT zone, an order block or a gap, actually absorbed aggressive flow on the retest. Just be certain which definition a video, indicator, or scanner is using before you act on it.
Common Volume Imbalance Mistakes
Most losses attributed to the concept come from misclassification or missing context rather than from the pattern failing. The recurring errors:
- Marking wick voids as VIs. If nothing traded in the range across three candles, it is an FVG, and the 50% partial-fill logic applies instead of the full-transit expectation.
- Marking true gaps as VIs. No wick overlap means an actual gap. Those behave like opening gaps, persistent magnets rather than quick re-delivery zones, and sizing the retest expectation off the wrong class costs money.
- Trading every body gap. Ranging, low-participation hours print small VIs constantly, and they rebalance meaninglessly within a few candles. Require displacement, a swept liquidity pool behind the move, and a draw beyond it before a VI earns an order.
- Expecting an edge bounce. A VI is not an order block; there is nothing resting inside it to defend the near edge. Plan for price to transit the zone and position at the far boundary or midpoint, with the stop beyond structure, never just beyond the gap.
- Fading displacement at a VI. Re-delivery through a bullish VI in an uptrend is usually a pullback completing, not a reversal signal. Counter-trend entries at these zones fight the very intent the gap proved.
- Ignoring timeframe and session. A 1-minute VI printed in the dead hours between sessions is noise. The same geometry on a 15-minute or hourly chart inside a kill zone is evidence.
On the evidence question, be honest with yourself: there is no canonical published fill-rate statistic for volume imbalances. On liquid instruments, most body gaps created inside trending sessions do get at least partially re-delivered within a session or two, but treat that as an illustrative tendency, not a law.
Verify it on your own data. Log a hundred volume imbalances on your pair and timeframe, record time-to-fill, the reaction at the far edge, and whether the prior trend resumed, then split the results by regime. Trending versus ranging conditions, and displacement-born versus chop-born gaps, produce very different numbers, and your own distribution is worth more than anyone's claimed win rate.
Frequently Asked Questions
Do volume imbalances always get filled?
No. Most VIs inside liquid, trending legs are eventually re-delivered through, but eventually can outlast your trade, and some never fill because price reached its draw and repriced entirely. Treat the fill as a tendency that needs displacement and higher-timeframe context behind it, never as a guarantee to lean size on.
Is a volume imbalance bullish or bearish?
It inherits the direction of the candles that created it. A body gap up is a bullish VI expected to act as re-delivery support; a body gap down is bearish resistance. But the object is not a standalone signal, it takes its bias from the displacement leg and the higher-timeframe structure it sits inside.
Can a volume imbalance overlap a fair value gap?
Yes, and in strong displacement it happens often: the three-candle wick void and the two-candle body gap can cover overlapping prices. That overlap is genuine confluence, two independent measurements agreeing that delivery was one-sided there, and many traders grade the combined zone above either signal on its own.
Does the ICT volume imbalance require volume data?
No. Despite the name, it is defined purely by candle geometry, bodies gapping while wicks overlap, so no volume feed is involved. That is why it applies identically to spot forex, where centralized volume does not exist. The footprint diagonal imbalance is the version that genuinely requires executed bid/ask volume data.
Related query paths
The volume imbalance is one node in ICT's family of inefficiencies. These are the logical next queries, ordered from sibling definitions to application and evidence.
- What Is a Fair Value Gap (FVG)? — the three-candle wick void this article kept contrasting against; master both definitions side by side.
- NWOG & NDOG: Trading ICT Opening Gaps — the third gap class, where no trade occurred at all between sessions.
- Displacement in ICT: Reading Institutional Intent — the move that gives volume imbalances their meaning in the first place.
- Consequent Encroachment: The 50% FVG Rule — the midpoint logic that also governs sensible VI entries.
- Balanced Price Range (BPR): The ICT Reversal Zone — what forms when opposing gaps overlap and delivery rebalances both ways.
- FVG Fill Probability: What Backtests Reveal About Win Rates — the honest data angle on how often gaps actually fill.
- FVG vs Order Block: Which Entry Zone Should You Trade? — how it connects to fvg vs order block.
- fair value gap vs imbalance — Clarifies how volume imbalance, FVG, and liquidity void concepts differ.