
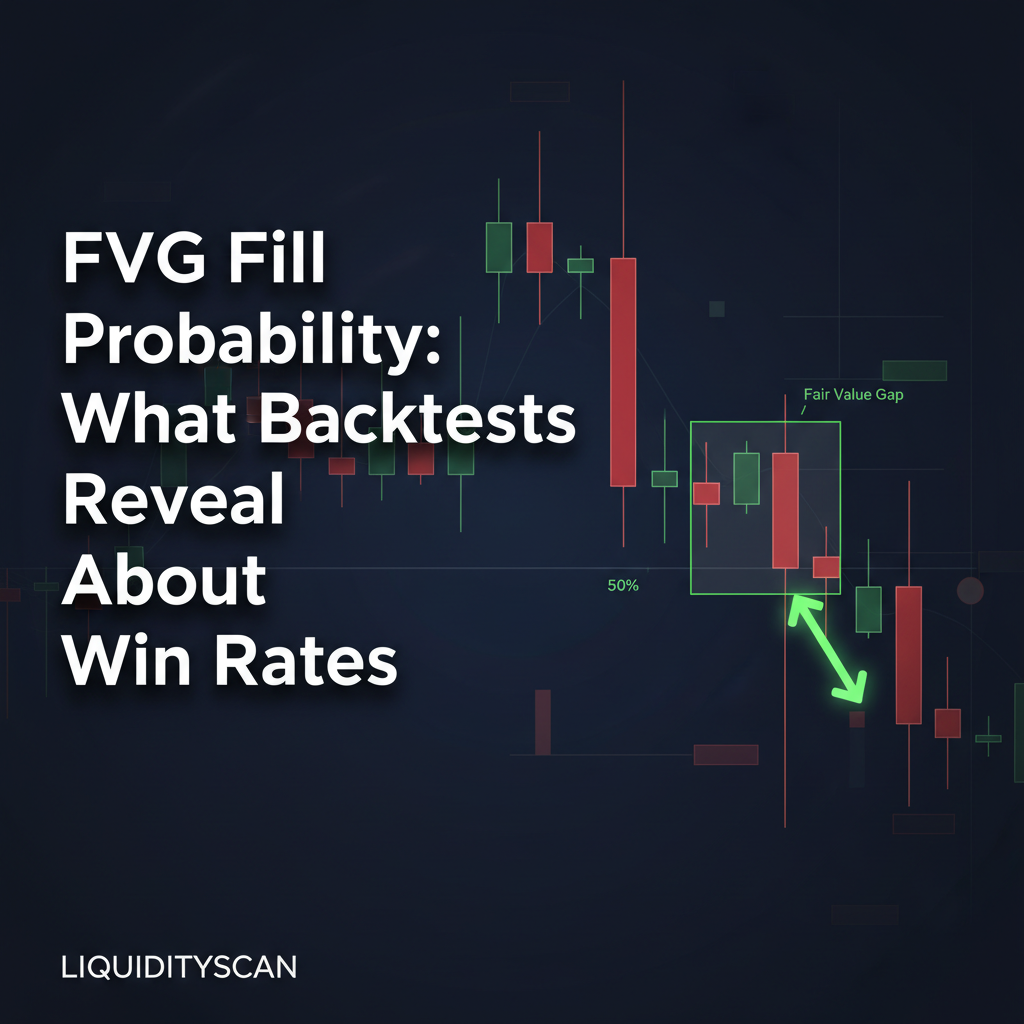
What Backtests Reveal About FVG Fill Rates
Systematic backtests of Fair Value Gaps reveal their performance is probabilistic, not deterministic, with win rates for reversal entries often falling between 40% and 60%. This range applies to well-defined setups in favorable conditions. An FVG in isolation, without supporting confluences, has a fill probability closer to a coin flip, and sometimes worse. The true edge isn't in the FVG itself, but in the context where it appears.
These inefficiencies in price delivery are a core concept in institutional analysis. As noted by exchanges like the CME Group, markets operate through an auction process. An FVG represents a failed auction, an aggressive move that left orders unfilled. The market's tendency to revisit these prices to facilitate business is the basis of the FVG fill trade. But 'tendency' is the operative word. Data shows this rebalancing is conditional, not guaranteed.
The 40-60% figure is a baseline. The probability shifts dramatically based on factors we can measure. A pro-trend FVG on a higher timeframe has a demonstrably higher chance of being respected than a counter-trend FVG on the M5 chart during a news driver. Understanding these variables is what separates traders who use FVGs effectively from those who are consistently stopped out.
Methodology: How to Quantify FVG Performance
To produce reliable data on FVG fill probability, a rigorous backtesting methodology is required. You can't just eyeball charts and count wins; you need a strict, repeatable ruleset. This approach is common in developing automated trading systems, as explored in academic research on performance-weighted rules, and it's just as vital for discretionary traders building a statistical playbook.
Defining a 'Fill': Consequent Encroachment vs. Full Rebalance
A 'fill' is not a binary event. For robust testing, we must define what counts. A common standard is price trading back to the 50% level of the FVG, known as consequent encroachment. This is often the minimum requirement for an FVG to be considered 'respected'. A full rebalance, where price trades through the entire gap to its opposite end, is a stricter definition. For most statistical models, a touch of the consequent encroachment is sufficient to classify the FVG as having been successfully mitigated.
Defining a 'Failure': Price Displacement Through the FVG
A failure is less ambiguous. An FVG fails when price trades back to it but then continues through its origin point with displacement. If a bullish FVG is entered, and price trades back into it but then breaks the low of the FVG's third candle, the setup has failed. This invalidation point must be clear and objective for the backtest data to have any integrity.
Data Set: Pairs, Sessions, and Lookback Period
A meaningful backtest requires a large dataset. Testing on a single pair for three months is not enough. A solid test would involve at least 12-24 months of data across multiple, distinct market environments. For example, a test could cover EUR/USD and the ES (E-mini S&P 500) futures contract across all sessions to capture different volatility and liquidity profiles. The goal is to see how the FVG performs in trending, ranging, high-volume, and low-volume conditions.
Key Factors Influencing FVG Fill Probability
The probability of an FVG holding is a dynamic variable. Four key factors consistently alter the odds: market structure, timeframe, proximity to liquidity sweeps, and session timing. Mastering these is how you move from simply spotting FVGs to qualifying them.
Market Structure Context: Pro-Trend vs. Counter-Trend
This is the most significant factor. An FVG that forms in alignment with the dominant market structure has a much higher probability of acting as support or resistance. For example, in a clear bullish uptrend on the 1H chart, a bullish FVG created by a strong move up is a high-probability retracement target. Conversely, a bearish FVG in the same uptrend is a low-probability short, likely to be run through as price seeks higher objectives.
Timeframe Correlation: H4 Bias vs. M5 Entry
No FVG exists in a vacuum. Its probability is heavily influenced by the higher timeframe narrative. A bullish M15 FVG has a greater chance of success if it's located within a premium/discount discount zone of the daily range and inside a H4 bullish order block. When multiple timeframes align, the probability stacks in your favor. When they conflict, the lower timeframe setup is often the victim.
Post-Liquidity Sweep FVGs
I cannot stress this enough: an FVG that forms as part of a move that sweeps significant liquidity is a grade-A setup. When price takes out a clear old high or low and then reverses with displacement, leaving an FVG in its wake, it's a powerful signal. This market structure shift (MSS) coupled with the FVG provides a concrete entry model with a higher-than-average probability of success. The LiquidityScan platform is designed to detect these sequences by flagging both the liquidity sweep and the resulting institutional candle patterns, like our CRT and SuperEngulfing signals, in real time.
Session Dynamics: London vs. New York Open
Liquidity is not evenly distributed throughout the day. FVGs formed during the high-volume London Kill Zone or New York Kill Zone tend to be more significant than those created in the low-volume hours of the Asian session. The increased volume and participation during these main sessions mean the displacement that creates the FVG is more likely to be institutional in origin, lending it more weight.
Why FVGs Fail: Understanding the Statistical Minority
Studying FVG failures is just as important as studying successes. When an FVG doesn't get filled, it's not a random event; it's providing you with information. The 40-60% of FVGs that fail are often doing so for predictable, higher-order reasons.
Immediate Continuation and Strong Displacement
Sometimes, the directional bias is so strong that the market has no time for inefficient rebalancing. Price leaves an FVG and simply does not look back. This often happens during major news releases or when a key macro level is broken. In these cases, the FVG becomes a sign of breakaway momentum, not a retracement target.
The Role of Balanced Price Ranges (BPRs)
An FVG can be immediately negated if it forms opposite a prior, opposing FVG, creating a Balanced Price Range (BPR). When a bullish FVG and a bearish FVG overlap, they effectively cancel each other out. Price often slices through these areas with little friction, as the range is considered 'efficient' or balanced from a two-sided auction perspective. Recognizing BPRs helps you avoid taking trades in these neutral zones.
Inducement and Higher Timeframe Objectives
Sophisticated market participants know that retail traders are taught to trade FVGs. Therefore, obvious, perfectly formed FVGs can be used as inducement. Price might rally towards a clean bearish FVG, drawing in short-sellers, only to trade right through it to attack a liquidity pool resting just above. The FVG was not the real target; it was bait. The true objective was a higher timeframe level, and learning to validate the FVG with order flow is key to distinguishing bait from a real setup.
Translating Probability into a Statistical Edge
The statistical edge in trading FVGs doesn't come from a high win rate. It comes from understanding the probabilities and applying a risk model that accounts for them. If you know that a pro-trend, post-liquidity-sweep FVG in the NY session has a 60% chance of holding, you can structure a trade with a 2:1 or 3:1 risk-to-reward ratio. With such a model, you only need to be right 33% of the time to be profitable.
Your job as a trader is not to predict which single FVG will work. It is to be a statistician, systematically identifying the characteristics that improve an FVG's fill probability, and then executing a trading plan that plays those odds over a large series of trades. That is how a 40-60% win rate is forged into a consistently profitable strategy.
Frequently Asked Questions
Do FVGs actually work?
Yes, but not all of them, and not all the time. Their effectiveness is probabilistic and highly dependent on market context. They 'work' best when aligned with higher timeframe market structure, session liquidity, and after a clear liquidity sweep.
What is a good win rate for an FVG strategy?
A realistic win rate for a discretionary FVG strategy is between 40% and 60%. Traders who claim significantly higher win rates are often either not tracking their data rigorously or are only counting highly selective, multi-confluence setups. Profitability comes from coupling this win rate with a positive risk-to-reward ratio.
How does FVG performance look in 2024?
FVG performance remains consistent with historical backtests. The underlying principles of auction market theory and liquidity-driven moves are constant. However, specific market volatility and algorithmic behavior in 2024 may alter which sessions or pairs exhibit the highest probability setups, reinforcing the need for continuous analysis rather than static rules.