
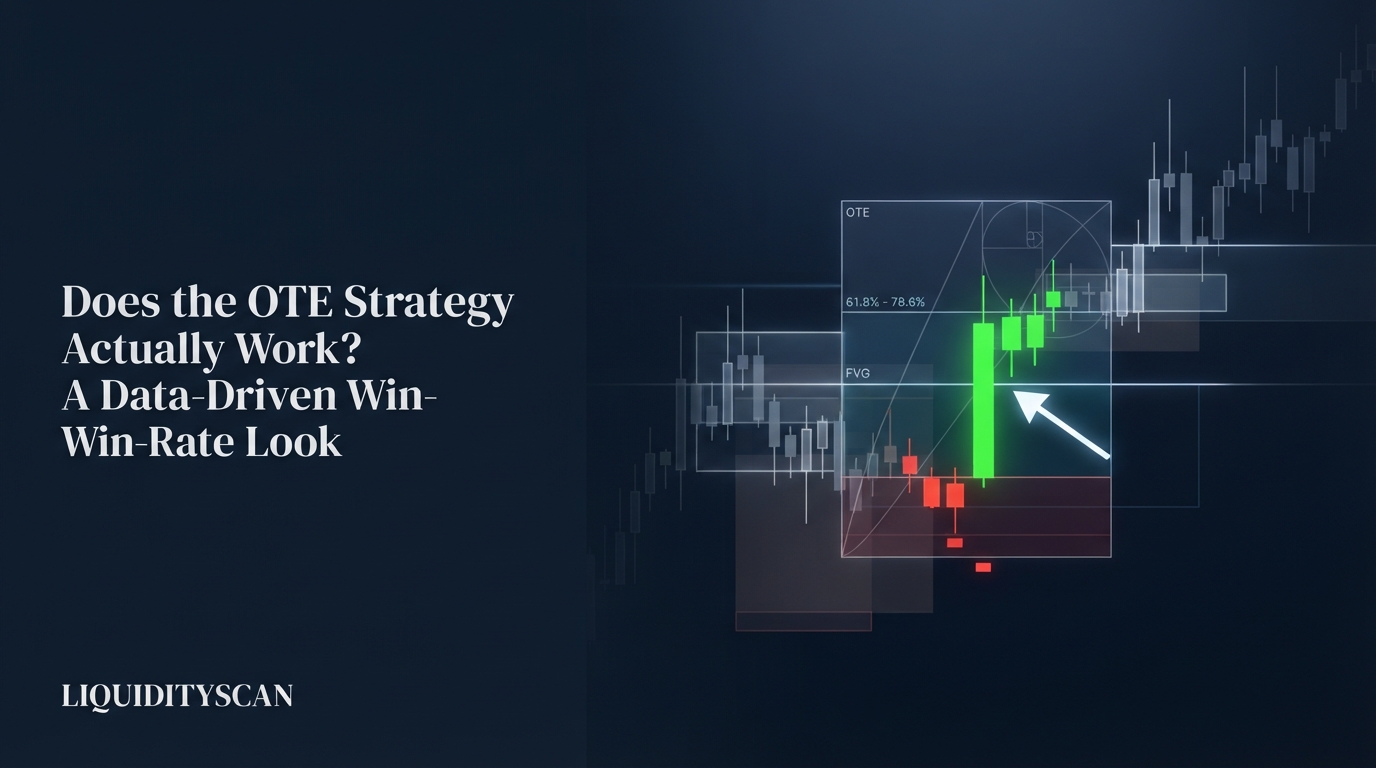
Does OTE Work? Defining What "Working" Actually Means
OTE works as a framework, not a standalone signal. The 62–79% zone can produce positive expectancy when paired with a trend filter, a liquidity narrative, and displacement confirmation — and bleeds money as a raw Fibonacci touch. The edge is the filters, not the ratio.
Before arguing about win rates, define the test. A strategy "works" when it has positive expectancy after costs: expectancy = (win rate × average win) − (loss rate × average loss), minus spread, commission, and slippage. Win rate alone tells you nothing. A 65% win rate at 0.5R loses to a 35% win rate at 3R over any meaningful sample.
This matters for Optimal Trade Entry (OTE) because the setup is structurally a low-win-rate, high-payoff pattern: entry deep in the retracement, stop close behind the swing, target at or beyond the origin leg's extreme. The following table is pure arithmetic — not backtest results — showing expectancy per trade in R units, before costs:
| Win rate | Avg reward (R) | Expectancy per trade |
|---|---|---|
| 25% | 3R | 0.00R (breakeven) |
| 30% | 3R | +0.20R |
| 40% | 2R | +0.20R |
| 40% | 3R | +0.60R |
| 50% | 1R | 0.00R (breakeven) |
| 50% | 2R | +0.50R |
| 55% | 1R | +0.10R |
Read the first and fourth rows carefully. At 3R average payoff, the breakeven win rate is 25%. A trader hitting 40% at 3R earns +0.60R per trade — a strong edge — while a 55% win rate at 1R barely covers costs.
So the honest question is never "what is OTE's win rate?" It is "does the combination of win rate and payoff clear breakeven after costs, on my rules, in my market?"
The Mechanical Case for OTE: Why the Zone Has Logic
OTE is the 62–79% retracement of an impulse leg, anchored from the swing that started the move to the one that ended it. Entering there encodes buy-the-discount logic, not numerology. In a bullish leg, the band sits well below equilibrium of the dealing range — deeper than the midpoint where premium and discount logic says value favors longs.
The second mechanical advantage is proximity to invalidation. Your stop belongs just beyond the swing low that anchors the fib. Because the band ends at 79%, entry-to-invalidation distance is a small fraction of the leg, while the first logical target — the leg's high — is the full remaining distance. Deep entry plus nearby stop equals asymmetric R:R.
Concrete arithmetic on EURUSD: an impulse leg runs from 1.0800 to 1.0900. The OTE band spans roughly 1.0838 (62%) down to 1.0821 (79%). Enter at 1.0830, stop at 1.0795 — 35 pips of risk.
Target one, the old high at 1.0900, pays 70 pips: 2R. Target two, buy-side liquidity resting above 1.0930, pays 100 pips: about 2.9R. Plug those payoffs into the table above and the setup is profitable at win rates most traders would call mediocre.
That is the entire case for OTE in one sentence: it systematically manufactures trades where being right pays multiples of being wrong. Whether you are right often enough is a separate question — and that is where the data gets messy.
Why Backtests Disagree on Whether OTE Works
Search for OTE backtests and you will find community results ranging from "clearly unprofitable" to "strong edge" — on the same instrument. Neither camp is lying. They are testing different strategies that share a name, because "trade the 62–79% pullback" leaves at least five decisions open, and each one can flip the outcome:
- Trend filter or none. Taking every OTE in both directions is a different strategy from taking only pullbacks aligned with higher-timeframe bias. Illustratively, the same mechanical rules can swing 15–20 percentage points of win rate between a trending year and a choppy one — a with-trend filter captures most of that gap.
- Swing anchor choice. Which high and low define the leg? A 3-candle fractal, a 5-candle fractal, and a structure-based swing produce different fib placements — and therefore different entries, stops, and results — on the identical chart.
- Time filter. Restricting entries to a kill zone (London open, New York AM) removes the low-volatility hours where retracements drift through levels without follow-through. Tests without a session filter systematically look worse.
- Stop convention. Stop below the 79% level, below the swing low, or an ATR buffer beyond it — three conventions, three different loss rates. Tight 79% stops get clipped by wicks that would have been winners under the swing-low convention.
- Market and regime. OTE assumes impulse-retrace-continuation behavior. Instruments and periods dominated by mean reversion punish it; sustained trends reward it.
This is why quoting a single OTE win rate is dishonest. Any number you see is a property of one rule set, one market, one period — not of the concept. The concept only becomes testable once you freeze every variable above.
The Failure Modes That Kill OTE in Practice
Most losing OTE trades fail before entry — the trade was structurally wrong, not unlucky. Four failure modes account for the bulk of them.
Counter-trend anchoring. The trader fibs a corrective leg inside a larger downtrend and buys its 70% retracement — a discount entry within a move that exists only to be reversed. If the leg you anchored is itself the pullback on the higher timeframe, your "discount" is the institution's premium.
No liquidity narrative. The strongest legs begin by taking something: a liquidity sweep of an old low, a raid on equal highs. A leg that starts from nowhere, sweeps nothing, and has no clear Draw on Liquidity beyond its high gives the market no engineered reason to continue. OTE entries on such legs are fib-touching, not smart-money logic.
No displacement confirmation. Displacement — the energetic, gap-leaving expansion candle — is the footprint that distinguishes an institutional leg from drift. A leg that grinds up without leaving a Fair Value Gap (FVG) gives you no evidence anyone with size participated. Retracements into such legs routinely run through the entire fib range.
Mid-range legs. An impulse that launches from equilibrium of the larger dealing range, rather than from a swept extreme, has already spent much of its room. Its OTE retracement often marks distribution, not re-accumulation. Location of the leg inside the higher-timeframe range matters as much as the retracement depth within the leg.
Notice the common thread: none of these are execution errors. They are context errors — the 62–79% zone was drawn correctly on the wrong leg.
What Separates Traders Who Make OTE Pay
The difference between OTE-positive and OTE-negative traders is rarely entry precision. It is selectivity. The losing pattern is treating every 62% touch as a signal; the winning pattern is treating OTE as the final condition in a stack that was already valid without it.
A defensible stack looks like this — each condition removes a failure mode from the previous section:
- Higher-timeframe bias established first.
- A sweep of external liquidity originating the leg.
- Displacement with an FVG confirming intent.
- A Break of Structure (BOS) or Change of Character (CHoCH) confirming the shift.
- The retracement arriving during a kill zone.
- Ideally, the OTE band overlapping a discrete Order Block or FVG rather than floating on empty price.
The cost of that stack is frequency. A raw fib-touch approach might generate several trades per day; the full stack might produce two or three A-grade setups per week on a given pair. That trade-off is the point — expectancy per trade rises as the sample shrinks to contexts where continuation is engineered rather than hoped for.
Scanning for those overlaps manually across dozens of pairs is the bottleneck, which is where a tool like LiquidityScan — which flags sweeps, structure shifts, and order block confluence across markets in real time — earns its place in the workflow.
One quotable rule of thumb: OTE tells you where in the leg to enter. Everything else in the stack tells you whether the leg deserves an entry at all. Traders who invert that order — zone first, context later — are the ones producing the losing backtests.
How to Test Whether OTE Works for You
Because published results are rule-set-dependent, the only OTE win rate that matters is the one from your own rules on your own market. A proper self-test looks like this:
- Freeze the rules in writing. Define the swing anchor (e.g., structure swings confirmed by BOS), the entry trigger (limit at 70.5% or touch of 62%), the stop convention (fixed buffer beyond the swing), the target logic (opposing liquidity), and every filter (bias, sweep, kill zone). If a rule needs judgment, define the judgment.
- Collect 100+ samples per condition set. Bar-replay forward through historical data — no scrolling back after seeing the outcome. Below roughly 100 trades, a true 40% strategy can easily print anywhere from 30% to 50% by chance alone; small samples are noise.
- Log MFE and MAE on every trade. Maximum favorable and adverse excursion tell you what the raw zone offered before your management touched it. If MAE data shows winners routinely drawing down to 85% of the leg, your 79% stop convention — not the concept — is the leak.
- Separate regimes. Split results into trending and ranging segments (a simple higher-timeframe structure classification is enough). A strategy that earns +0.5R per trade in trends and −0.4R in ranges is not "mediocre overall" — it is excellent with a regime filter you have not yet applied.
- Charge yourself costs. Deduct realistic spread and slippage per trade. A +0.15R gross edge on a 1-minute strategy can be a net loser after costs; the same edge on 4H data survives easily.
Run the unfiltered version and the full-stack version side by side. The gap between those two cohorts is the measured value of your filters — and it settles the "does OTE work" argument with your own data instead of someone else's YouTube thumbnail.
The Honest Verdict on OTE
The zone has genuine logic: it forces entries into discount with invalidation nearby, which manufactures the asymmetric payoffs that let modest win rates compound. That is a real structural advantage, and it is why the setup survives scrutiny better than most retail patterns.
But the ratio itself is not the edge. Nothing about 62–79% predicts continuation; the prediction comes from the context — the sweep that started the leg, the displacement that confirmed it, the session that hosts it, the higher-timeframe draw beyond it. Strip those away and OTE degrades into fib-touching with above-average R:R and a below-breakeven hit rate.
So does OTE work? Yes — conditionally, measurably, and only as the entry component of a filtered model. Treat the published win-rate debates as evidence of variable sensitivity, not truth about the concept, and let a frozen-rules, 100-plus-sample test on your own market give you the number that actually pays.
Frequently Asked Questions
What win rate does an OTE strategy need to be profitable?
It depends entirely on the average payoff. At 3R average reward, breakeven is 25% before costs; at 2R it is 33%; at 1R it is 50%. Because OTE entries typically target 2–3R minimum, a realistic profitability threshold sits around 30–40% — add several points of buffer for spread and slippage.
Is OTE just a regular Fibonacci retracement?
The tool is the same; the model is not. Retail fib trading treats every ratio as potential support. OTE uses only the 62–79% band, requires the anchored leg to have taken liquidity and shown displacement, and places entries in deep discount with invalidation at the swing. The filters, not the ratios, are the difference.
Why do I keep getting stopped out at the 79% level?
Usually a stop-convention problem. Stops parked exactly beyond 79% sit inside the wick territory of the anchoring swing, where late sweeps run before continuation. Placing the stop beyond the actual swing low with a small buffer costs some R:R but survives the raid — test both conventions and compare MAE data.
Does OTE work on crypto and lower timeframes?
The logic transfers because liquidity, retracement, and continuation exist in every leveraged market — crypto included. But costs scale against you on lower timeframes: spread and slippage consume a larger share of each R. Most traders find OTE more forgiving on 15-minute-and-above charts anchored to a higher-timeframe bias.
Related query paths
If you are auditing OTE seriously, these are the logical next questions in order — from the zone's definition to the tools for testing it on your own data.
- OTE Explained: The ICT Optimal Trade Entry Zone — the full definition, anchoring rules, and levels behind the zone tested here.
- Equilibrium vs OTE: The Right ICT Entry Level — when the 50% level is the better entry and when only the deep zone qualifies.
- OTE Optimal Trade Entry: The Institutional Model vs. Retail Fibs — why the same ratios produce opposite results under two different models.
- Do Order Blocks Still Work? A Data-Driven Framework for 2026 — the same evidence-first treatment applied to OTE's most common confluence partner.
- FVG Fill Probability: What Backtests Reveal About Win Rates — how fill-rate data behaves for the displacement gaps that validate OTE legs.
- How to Backtest an ICT Strategy the Right Way — the frozen-rules, replay-based testing procedure this article prescribes, step by step.
- OTE vs Order Block: Which Entry Gives the Better Fill? — how it connects to ote vs order block.