
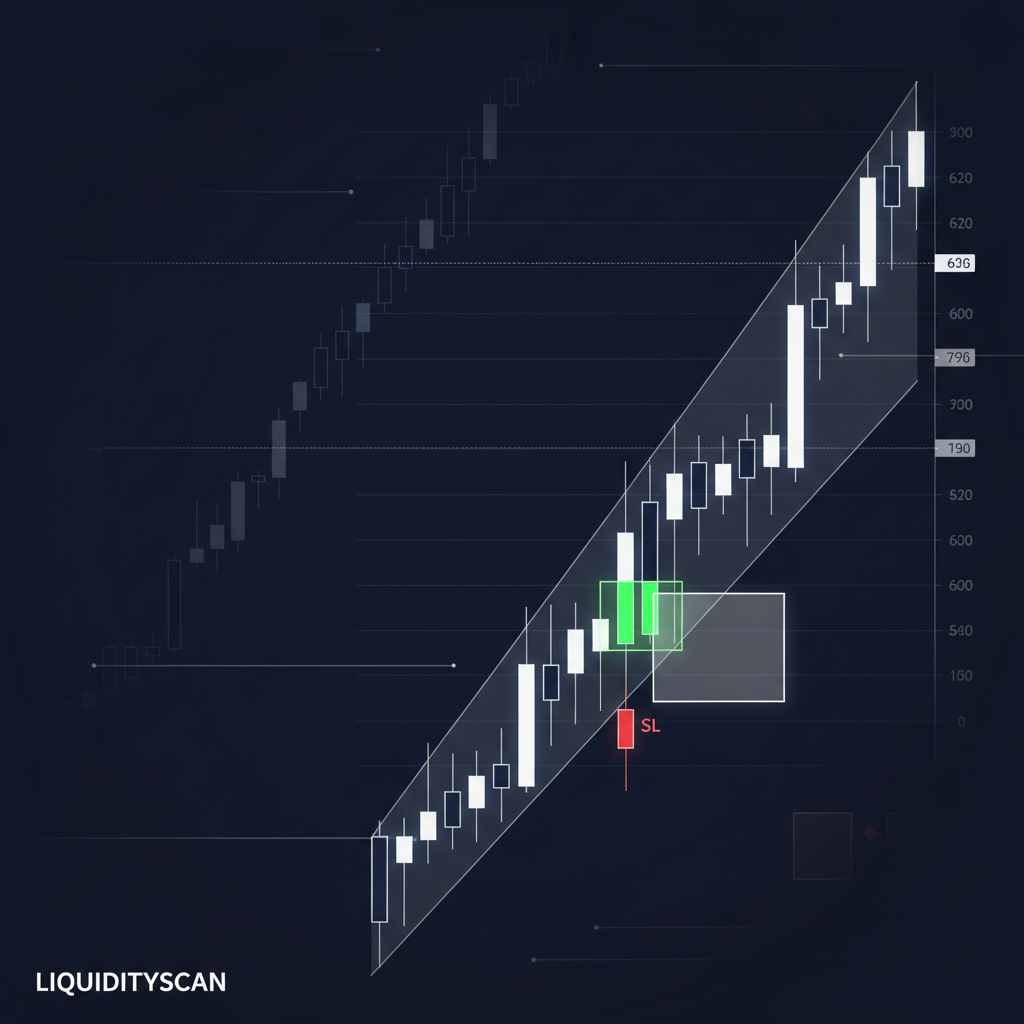
Defining Optimal Trade Entry (OTE)
Optimal Trade Entry (OTE) is a specific price retracement pattern used in Inner Circle Trader (ICT) methodologies to identify high-probability entry points. It is defined by price pulling back into a zone between the 62% and 79% Fibonacci retracement levels of a significant price swing, with the 70.5% level considered the sweet spot for institutional order execution.
The value of OTE is not the Fibonacci numbers themselves. It is what those numbers represent: a deep discount or premium within a defined dealing range, where price has rebalanced enough for large orders to be delivered efficiently. This programmatic delivery of price is why patterns like OTE recur, a behavior consistent with how algorithmic execution works on institutional desks.
The Core Fibonacci Levels of an OTE
The 62% Level: Entry to the Zone
The 0.62 retracement marks the shallow edge of the OTE. Price reaching this level signals that a meaningful pullback is underway, but it is only the entrance to the zone, not a trigger on its own.
The 70.5% Level: The Sweet Spot
The 0.705 level sits in the heart of the zone and is treated as the optimal point for entry. It offers a deep enough discount to keep risk tight while still respecting the prevailing direction of the impulse.
The 79% Level: Deep Retracement Boundary
The 0.79 retracement is the far boundary. A pullback beyond it starts to threaten the original swing, so entries that fail to hold above 79% are often invalidated quickly.
How to Apply the OTE Tool Correctly
Step 1: Identify the Relevant Price Swing
OTE only works after a clear Break of Structure (BOS) or Market Structure Shift (MSS) with displacement. First confirm that structure has actually turned. Without that shift, you are measuring a retracement in a market with no directional conviction.
Step 2: Anchor the Fibonacci Tool
Draw the Fibonacci tool from the start to the end of the impulsive leg that caused the structure shift, low to high for longs and high to low for shorts. Anchoring on the wrong leg is the most common OTE mistake.
Step 3: Look for Confluence within the OTE Zone
OTE should not be used in isolation. Demand confluence from other ICT arrays such as a Fair Value Gap (FVG), an Order Block, or a breaker sitting inside the zone. When the 70.5% level overlaps one of these, the setup earns its label.
OTE in the Context of a Trading Model
Finding OTE in a Discount for Buys
For longs, you want the OTE zone to fall in the discount half of the dealing range, below the 50% equilibrium. Buying at a discount after a bullish shift keeps you aligned with institutional pricing rather than chasing.
Finding OTE in a Premium for Sells
For shorts, the OTE should form in the premium half, above equilibrium. Selling into premium after a bearish shift means you enter where price is expensive and smart money is likely to distribute.
OTE vs. Standard Fibonacci Retracement
A retail trader often draws a standard Fibonacci retracement on any swing and buys the 61.8% level generically. ICT's OTE is stricter. It requires specific market conditions, displacement and an MSS, plus context from premium and discount arrays. The tool looks the same, but the OTE is part of a structured model based on institutional order flow, not a standalone signal.
A Chart Example of the OTE Pattern
On the E-mini S&P 500 (ES), imagine a bullish MSS during the New York session. Price displaces up, leaves an FVG, then retraces. It taps the 70.5% level exactly where the FVG sits, holds, and continues higher. The Fibonacci zone did not cause the move. It simply told you where the discounted entry lived.
Frequently Asked Questions
Is OTE a guaranteed entry signal?
No. OTE is a high-probability location, not a guarantee. It works only with a prior structure shift and confluence, and it still requires disciplined risk management.
Can OTE be used on any timeframe?
Yes, the concept is fractal and appears from monthly charts down to the 1-minute. The key is anchoring the Fibonacci tool to a genuine impulse leg on the timeframe you trade.
What other ICT concepts should be used with OTE?
Pair OTE with Fair Value Gaps, order blocks, premium and discount arrays, and liquidity. These provide the confluence that turns a retracement level into a real setup.
Related query paths
OTE is one piece of a larger model. Build the surrounding skills here:
- The Ultimate ICT Market Structure Framework for Precision Trading — confirm the structure shift OTE depends on.
- FVG Entry Strategy: A Precision Guide for ICT Traders — the key confluence often found inside the OTE zone.
- The Definitive Guide to ICT Trading — foundational context for the whole methodology.
- How to Find Your Edge in ICT Trading — integrate OTE into a complete personal model.
- Equilibrium vs OTE: The Right ICT Entry Level