
What Is the Difference Between the Golden Pocket and the OTE Zone?
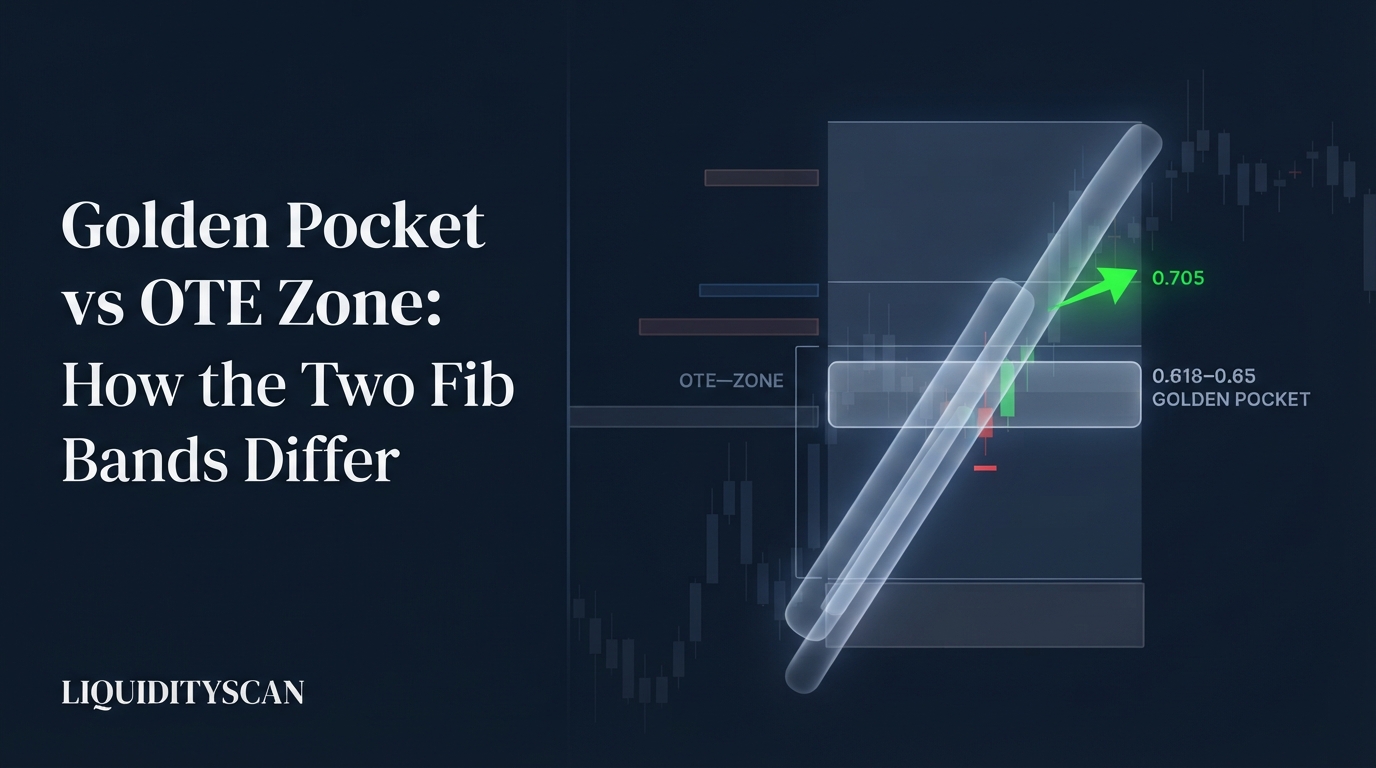
The golden pocket is the 0.618–0.65 Fibonacci retracement band popularized by crypto traders. ICT's Optimal Trade Entry (OTE) covers 0.62–0.79 with a 0.705 sweet spot. The two overlap at 0.62–0.65, but OTE runs far deeper and is justified by value, not ratio magic.
Comparing the golden pocket vs OTE is really comparing two schools of thought that happen to share a slice of the same ruler. The golden pocket grew out of Fibonacci tradition and crypto-community reflexivity. OTE comes from the Inner Circle Trader curriculum, where the retracement tool is only a measuring stick for how deep into discount a pullback has traveled.
That distinction sounds academic until you drop both bands on one chart. The entries fill at different prices, the stops belong in different places, and the pullbacks each band survives are not the same. Below, both bands get priced on a single BTCUSDT leg so the trade-offs become concrete numbers instead of philosophy.
Golden Pocket vs OTE: The Two Definitions
The golden pocket: 0.618–0.65
The golden pocket is the zone between the 0.618 and 0.65 retracement of an impulse leg. The 0.618 level is the inverse of the golden ratio (1 ÷ 1.618), which gives the band its name. The 0.65 boundary was added as a practical buffer, because price frequently overshoots the pure ratio by a fraction before turning.
The term spread through crypto communities during the 2017–2021 cycles and is now default vocabulary on BTC and ETH charts. Its justification is a blend of mathematical tradition and reflexivity: millions of terminals draw the same two levels, so limit orders, alerts, and stop clusters form inside the band.
The level partly works because enough participants act as if it will. That is genuine confluence — just crowd-generated rather than value-generated.
OTE: 0.62–0.79 with the 0.705 sweet spot
OTE spans the 0.62 to 0.79 retracement of a qualified leg, with 0.705 — the midpoint of 0.62 and 0.79 — treated as the sweet spot for entries. ICT's defense of the zone has little to do with the Fibonacci sequence itself.
In the ICT model, a swing low to swing high defines a Dealing Range. Everything below the 50% midpoint — Equilibrium — is discount for longs; everything above it is premium for shorts. OTE is simply the deep half of discount: the region where a long gets filled meaningfully below the range's fair value.
The fib tool is a convenience for locating that region, not the reason it matters. Replace the retracement with "the lower quarter of the range plus a buffer" and the logic survives intact — which is exactly the point. OTE is a proxy for Premium and Discount, not ratio worship.
Golden Pocket vs OTE Comparison Table
The overlap between the bands is narrow and the differences are structural. Here is the side-by-side:
| Attribute | Golden Pocket | OTE Zone |
|---|---|---|
| Band | 0.618–0.65 | 0.62–0.79 |
| Sweet spot | 0.618 touch | 0.705 |
| Origin | Fibonacci tradition; crypto communities | Inner Circle Trader (ICT) curriculum |
| Justification | Ratio significance plus self-fulfilling crowd confluence | Proxy for deep discount/premium within a dealing range |
| Valid anchor | Any visually obvious impulse | A leg with a liquidity sweep at its origin |
| Depth tolerance | Invalidated past roughly 0.65–0.66 | Valid to 0.79; range intact to the swing itself |
| Typical stop | Just beyond the band | Beyond 0.79 or beyond the swing extreme |
| Fill behavior | Fills early; run through in engineered legs | Fills late or not at all; survives deep runs |
| Best regime | Momentum continuation with crowd confluence | Post-sweep institutional expansion legs |
Three practical consequences fall out of the table. First, depth tolerance: an OTE trader is structurally prepared for a retracement that travels 79% of the leg, while a golden-pocket trader is invalidated once price closes much beyond 0.65. The same pullback can be a textbook entry for one and a confirmed loss for the other.
Second, fill behavior: golden-pocket limit orders fill earlier and more often, which feels like an advantage — until a leg is engineered. When an algorithmic pullback runs deep to collect resting orders, the golden pocket is precisely where the visible crowd is positioned, and its stops sit just beneath it, inside the OTE band. That cluster is fuel, not protection.
Third, stop conventions differ by design. Golden-pocket practice puts stops just under 0.65–0.66, keeping risk tight but fragile. ICT convention places stops beyond 0.79 or beyond the swing that anchors the range, on the logic that only a violation of the range origin actually breaks the trade idea.
The Anchoring Difference: Any Impulse vs a Dealing-Range Leg
The least discussed difference is the most consequential: which legs you are allowed to measure. Golden-pocket users anchor any impulse that looks clean — a strong daily candle, a breakout leg, a bounce. There is no qualifying test; the ratio is assumed to apply universally.
OTE is stricter. The leg must define a legitimate dealing range, and in the ICT model that means the move should begin with a Liquidity Sweep. For a bullish leg, the origin low should have taken out an old low or equal lows, purging sell-side liquidity before reversing.
The leg should then show Displacement — an energetic, imbalance-leaving push — and ideally break structure in the new direction.
Why the ceremony? Because the sweep is what tells you large participants likely built inventory at the origin. A retracement into deep discount of that specific leg offers to fill you near the prices where the accumulation happened. A retracement of a random impulse offers no such narrative — it is just a fib on a chart.
Practically: anchor the OTE fib from the extreme of the sweep wick to the top of the displacement leg (reverse for shorts), and only after the leg confirms with a structure break. If the origin swept nothing, most ICT traders skip the setup entirely, however clean the ratio looks.
When Each Band Works — and How to Use Both Together
The golden pocket earns its keep in momentum continuation. In a strong trend with dense retail participation — BTC in a bull phase, a major index in a steady grind — shallow corrective pullbacks routinely terminate in the 0.618–0.65 slice. That is where the crowd's bids stack, and nobody is engineering against a move everyone already agrees on.
Add visible confluence — prior resistance turned support, a round number, a widely watched moving average — and the band's self-fulfilling logic is at its strongest.
OTE earns its keep after engineered events. Following a raid on liquidity — a Judas Swing at a session open, a sweep of equal lows — the subsequent expansion leg frequently retraces deep before the real move, precisely because the algorithm has no interest in filling latecomers at generous prices.
Those retracements trade straight through the golden pocket and find their turn between 0.705 and 0.79.
Can you use both? Yes, and the combinations are practical rather than theoretical:
- Golden pocket as alert, OTE as entry. Treat the first touch of 0.618 as an alarm, not a fill. Start reading lower-timeframe structure there, and place the actual limit at 0.705.
- The overlap as the highest-confluence slice. 0.62–0.65 sits inside both bands, which means both crowds' orders stack there. On qualified legs, a partial entry in the overlap with the balance at 0.705 averages the two philosophies.
- Band plus array, never band alone. Either zone becomes dramatically more selective when it intersects a discount Order Block or an unfilled Fair Value Gap (FVG) — the fib says how deep, the array says exactly where.
If you want the qualifying condition checked automatically, LiquidityScan's sweep and premium/discount scanners flag legs whose origin actually purged liquidity — the difference between an OTE-grade leg and an ordinary fib.
Worked Example: Pricing Both Bands on One BTCUSDT Leg
Take an illustrative BTCUSDT 4H sequence. Price sits on equal lows near 58,200. A wick sweeps them to 58,000, sell-side liquidity is purged, and the market displaces upward to 63,200 over several sessions, breaking a prior swing high on the way.
Anchor the retracement from 58,000 to 63,200 — a 5,200-point leg with a swept origin, so it qualifies for both tools.
The levels price out as follows:
- 0.618 → 59,986 and 0.65 → 59,820: the golden pocket is a 166-point band.
- 0.62 → 59,976, 0.705 → 59,534, 0.79 → 59,092: the OTE zone is an 884-point band.
- The shared 0.62–0.65 slice: 59,820–59,976.
Now three trade plans, all targeting the old high at 63,200:
- Golden-pocket plan: limit at 59,986, stop just under the band at 59,650. Risk ≈ 335 points, reward ≈ 3,215 — roughly 9.5R on paper. The catch: the stop sits inside the OTE band, so any pullback that behaves like an engineered leg removes it on the way to 0.705.
- OTE plan, tight convention: limit at 59,534 (0.705), stop under 0.79 at about 59,000. Risk ≈ 535 points, reward ≈ 3,665 — roughly 6.8R, and the position survives everything short of a full-band violation.
- OTE plan, structural convention: same 59,534 entry, stop under the swept low at 57,900. Risk ≈ 1,635 points — roughly 2.2R, but the trade is only wrong if the entire dealing range fails.
All figures are illustrative pricing, not a backtest. The lesson: the same leg and the same target produce three very different risk models. Choosing between the bands is not choosing a level — it is choosing how much adverse depth your thesis may absorb and which event falsifies it.
Also note whose entry fills. If the pullback bottoms at 0.64, only the golden-pocket trader participates; if it runs to 0.75, the golden-pocket trader is stopped and only the OTE trader participates. Over a sample of legs the two approaches are not competing for the same trades — they select different ones.
That is why "which band is better" backtests disagree so violently: results swing on regime, leg qualification, and stop convention — exactly what to isolate when testing either band on your own data.
Mistakes That Turn Either Band Into a Losing Signal
- Trading the band as a standalone signal. Neither zone predicts anything by itself. A fib band is a location, not a trigger — demand a qualified leg, a reaction at the level, and ideally an intersecting PD array before committing risk.
- Anchoring OTE to unqualified legs. If the origin swept no liquidity, you have drawn a golden-pocket trade with extra depth and inherited the worst of both worlds.
- Parking golden-pocket stops inside OTE. Stops at 0.66–0.70 sit in the most frequently visited slice of engineered retracements. If you must trade the pocket in a sweep-prone context, size down and use the structural stop instead.
- Fading expansions with counter-trend fibs. Both bands assume the impulse resumes. Buying discount directly into a higher-timeframe draw on the opposite side fails regardless of which band you prefer.
- Re-anchoring after violation. Redrawing the fib to a nearby swing so the setup "still works" is curve-fitting in real time. A violated band is information; take it.
The golden pocket vs OTE debate dissolves once you treat them as different instruments: one measures where the crowd agrees, the other measures where value sits inside a dealing range. Price both bands, qualify the leg, and let the 0.62–0.65 overlap do the arguing for you.
Frequently Asked Questions
Is the golden pocket the same as the 61.8% retracement?
Not quite. The 61.8% level is a single line derived from the golden ratio; the golden pocket is the band from 0.618 to 0.65. The extra width exists because price routinely overshoots the pure ratio before reversing, so the band captures reactions a single line would miss.
Why does ICT use 0.705 instead of 0.618?
0.705 is the midpoint of the 0.62–0.79 OTE band, and it sits deeper than the crowd's favorite level. The logic is value-based: the deeper the fill within discount, the better the entry relative to equilibrium — and the deeper level often survives the stop run that clears out 0.618 buyers.
Do Fibonacci retracement levels actually have predictive power?
Published evidence is mixed, and honest backtests vary heavily by market, regime, and how legs are selected. What is defensible: levels watched by many participants attract clustered orders, and deeper retracements into discount offer better asymmetry. Test with a fixed anchoring rule on your own data before trusting either band.
What happens if price retraces past 0.79?
In ICT terms the OTE entry is failing, but the dealing range stays valid until the origin swing is violated. Many traders treat a close beyond 0.79 as invalidation for the entry model while still tracking the range; a move through the swing extreme means the leg itself was wrong.
Related query paths
Where to go next, in the order the concepts build on each other:
- OTE Explained: The ICT Optimal Trade Entry Zone — the full mechanics of the 0.62–0.79 band before comparing it to anything.
- OTE Optimal Trade Entry: The Institutional Model vs. Retail Fibs — the deeper case for why ICT's fib usage departs from retail convention.
- Equilibrium vs OTE: The Right ICT Entry Level — how the 50% midpoint and the OTE band divide entry duties.
- How to Draw a Dealing Range in ICT (Correctly) — the anchoring skill both fib bands depend on, done properly.
- How to Draw Premium & Discount Zones (ICT Guide) — the value framework that OTE is actually a proxy for.
- What Is a Liquidity Sweep? — the qualifying event that turns an ordinary impulse into an OTE-grade leg.
- Fibonacci in ICT: Which Levels Actually Matter (and Why) — how it connects to fibonacci ict.