
What Does Fibonacci Mean in ICT Trading?
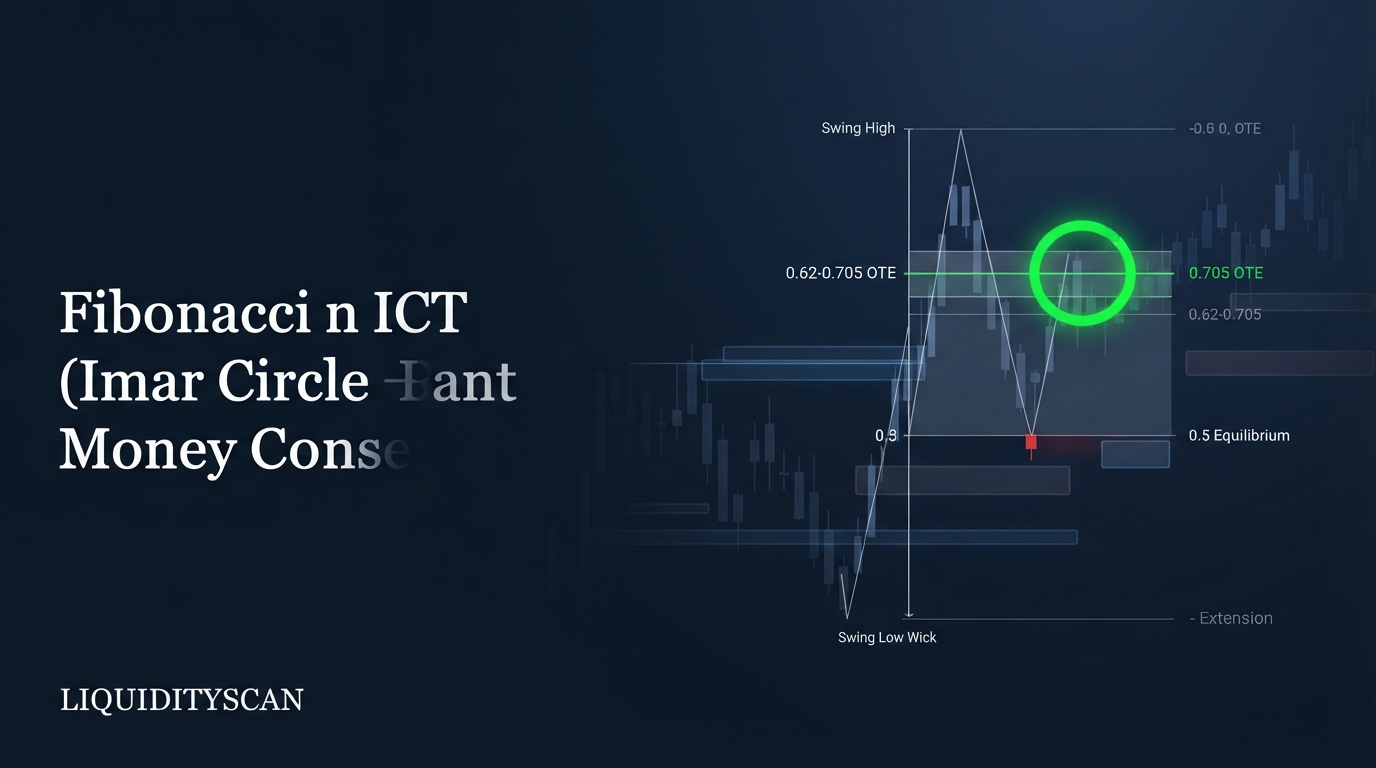
In ICT, Fibonacci is a measuring tool for the dealing range, not a predictive ratio system. You anchor it swing low to swing high (wicks included) and use three things: 0.5 equilibrium, the 0.62-0.79 OTE band for entries, and negative extensions for targets.
That is the entire toolkit. Inner Circle Trader methodology treats the fib not as a set of magic ratios but as a ruler laid across the current Dealing Range - the swing between the last points where buy-side and sell-side liquidity were actually taken. The ratios matter only because they quantify how deep price has returned into value.
This is why a Fibonacci ICT layout looks sparse next to a default retail template. Retail platforms plot 0.236, 0.382, 0.5, 0.618, and 0.786 and treat each one as potential support or resistance. ICT deletes most of them, adds 0.705, and reads what remains through a single lens: Premium and Discount.
How ICT Fibonacci Differs From Retail Fibonacci
Three structural differences separate the two approaches: what you anchor, what the levels mean, and what actually triggers a trade.
- Anchoring. Retail traders drag a fib across any visible swing, often three or four per chart. ICT anchors one fib on the dealing range - the swing between the points where liquidity was swept. If a leg did not take out a prior high or low, it generally does not deserve a Fibonacci at all.
- Meaning. Retail treats 0.618 as a level that holds because of golden-ratio properties. ICT treats every retracement level as a proxy for value: below 0.5 price is trading at a discount, above 0.5 at a premium. The ratio itself has no defensive power - it is a coordinate, not a wall.
- Trigger. Retail buys the touch of a ratio. ICT requires a liquidity sweep, displacement through structure, and a PD array - an Order Block or Fair Value Gap (FVG) - sitting inside the fib zone before an entry exists. The fib narrows the search area; the array provides the trade.
Same drawing tool, different question. Retail asks: will price bounce at 61.8%? ICT asks: has price returned to discount inside a range that just ran sell-side liquidity, and is there an array to trade from once it gets there?
Which Fibonacci Levels Actually Matter in ICT?
Only three groups: 0.5 equilibrium, the 0.62-0.705-0.79 Optimal Trade Entry (OTE) band, and the negative extensions used as expansion targets. Everything else can be removed from the tool.
0.5 - Equilibrium
The midpoint of the dealing range divides premium from discount. With a bullish bias you only want longs below it; with a bearish bias, only shorts above it. It also acts as a filter: a pullback that never reaches equilibrium is either a sign of exceptional strength or a setup you simply skip, because the risk-to-reward from a shallow retracement is structurally poor.
0.62, 0.705, 0.79 - the OTE band
This is the entry zone. The band sits deep in discount (or premium, for shorts), which means your stop below the range extreme is close while the bulk of the range - and everything beyond it - remains as profit potential. ICT flags 0.705 as the sweet spot: the midpoint of the band, deep enough for tight risk, shallow enough that price routinely reaches it before reversing. 0.79 is the last line; retracements beyond it start threatening the range low itself.
Negative extensions: -0.27, -0.62, -1, -2
Levels below 0 project targets beyond the range high (for longs). -0.27 is a conservative first objective just past the old extreme, -0.62 a standard second target, and -1 and -2 represent one and two full standard deviations of the range - the same projection logic ICT applies to CBDR and manipulation-leg extensions. Symmetry is the mechanism: expansions tend to travel in multiples of the range that produced them.
Recommended fib tool settings
| Level | Label | Role |
|---|---|---|
| 0 | Range extreme (anchor 2) | End of the impulse leg; targets project beyond it |
| 0.5 | Equilibrium | Premium/discount boundary; longs below, shorts above |
| 0.62 | OTE begins | Front edge of the entry band |
| 0.705 | OTE sweet spot | Primary entry reference inside the band |
| 0.79 | OTE limit | Deepest acceptable retracement before the range is at risk |
| 1 | Range extreme (anchor 1) | Stop-loss reference; invalidation beyond it |
| -0.27 | Target 1 | Conservative objective past the old high/low |
| -0.62 | Target 2 | Standard expansion objective |
| -1 | 1 standard deviation | Full range projected once beyond the extreme |
| -2 | 2 standard deviations | Extended runner target in strong trend delivery |
LiquidityScan's premium/discount and OTE tooling maps equilibrium and the entry band across timeframes automatically, which removes most of the manual re-anchoring work described below.
How to Anchor an ICT Fibonacci: Exact Rules
Anchoring is where most traders corrupt the tool. The levels are only as meaningful as the swing they measure, so the sequence matters.
1. Define the dealing range first
The fib goes on the range between the swing that took external liquidity and the opposite swing confirmed by displacement. For a long: the low is the wick that swept sell-side liquidity below an old low or equal lows; the high is the top of the displacement leg that broke structure afterward. No sweep, no valid range - and internal wiggles inside that range never get their own fib.
2. Anchor wick to wick
Use the full extremes, wick tip to wick tip. Wicks are delivered price - orders transacted there - so excluding them shrinks the range and shifts every level, moving your OTE band by several points or pips. Body-to-body anchoring is a retail convention ICT rejects for range measurement; the midpoint of an individual wick is a separate tool, Consequent Encroachment, and should not be confused with range anchoring.
3. Pull in the direction of the trade
For a bullish range, drag from the swing low (1.0) to the swing high (0), so the retracement levels count downward into discount and the negative extensions project above the high. For a bearish range, reverse it: high to low, with OTE sitting up in premium. Pulling the wrong way places your entry band in the wrong half of the range - a surprisingly common error that silently inverts the premium/discount read.
4. Re-anchor only when the range changes
Keep the fib fixed until one of two things happens: price violates the range extreme (a new external break creates a new range), or a fresh swing is confirmed by displacement and a Market Structure Shift (MSS) after new liquidity is taken. Re-drawing on every internal pullback is how retail traders end up with five conflicting fibs; internal swings are for refining entries, external swings are for the Fibonacci.
Why These Levels Work: The Premium-Discount Logic
ICT is explicit that the ratios are not mystical. They earn their place through three mechanical properties of how price is delivered.
Risk geometry. An entry at 0.705 with a stop just beyond the range extreme risks roughly 30% of the range. A target at -0.62 sits about 1.3 ranges away. That is roughly 4.5R baked into the structure before any trade management - versus about 1.6R for the same idea entered at a 0.38 retracement. The OTE band matters because of where it sits relative to invalidation, not because of Fibonacci arithmetic.
Array clustering. Impulse legs that displace leave behind a Fair Value Gap (FVG) in the body of the leg and an Order Block at its origin. Geometrically, those arrays tend to occupy the lower-to-middle third of a bullish leg - which is exactly where 0.62-0.79 lands. The fib does not cause the reaction; it predicts where the things that cause reactions are likely to cluster.
Value delivery. In the ICT model, the IPDA framework describes price as an engine seeking liquidity and rebalancing inefficiency. Institutions building longs want size filled cheap relative to the accepted range; discount is simply the machine-readable definition of cheap. Equilibrium at 0.5 is the boundary where that logic flips.
Be honest about the evidence, though. There is no rigorous public study showing 0.705 outperforms 0.618 in isolation - the two levels sit about 8-9% of range width apart, well inside ordinary noise. In backtests traders publish, reaction frequency at any single ratio varies heavily by regime and timeframe; the measurable edge shows up when the fib is combined with the sweep, displacement, array, and time-of-day filters. Treat any precise win-rate claim for a naked ratio as unverified, and test the full sequence on your own data instead.
Common Retail Fib Mistakes ICT Rejects
- A fib on every wiggle. Measuring internal swings produces levels with no liquidity story behind them; the tool belongs on the dealing range only.
- Treating ratios as support/resistance. Price does not bounce off 0.618 because it is 0.618. Without an array and a narrative, the touch of a level is not a trade.
- Buying shallow 0.382 retracements. Above equilibrium you are paying premium with a distant stop - the exact opposite of the institutional entry profile.
- Inconsistent anchoring. Switching between wicks and bodies, or between swings, until the levels line up is curve-fitting on a single chart.
- Stacking confluence fibs. Layering five fibs from five swings guarantees some level is always nearby, which makes every outcome look like confirmation.
- Ignoring time. A tap of OTE at 3 a.m. in a dead session is not the same event as a tap during a kill zone when the Draw on Liquidity is active.
Worked Example: A Complete Fibonacci ICT Sequence on EURUSD
Assume a bullish daily bias on EURUSD and a 15-minute execution chart during the New York AM session.
- Sweep. Price drops through the prior session low at 1.0712, wicking to 1.0710 and taking sell-side liquidity resting beneath it.
- Displacement. Within three candles, price rallies through the last lower high with a strong-bodied move, printing a Market Structure Shift and topping out at 1.0790. The leg leaves a 15-minute FVG between 1.0734 and 1.0741.
- Anchor. Fib drawn wick to wick, 1.0710 (level 1.0) to 1.0790 (level 0) - an 80-pip dealing range. Equilibrium: 1.0750. OTE band: 0.62 at 1.0740, 0.705 at 1.0734, 0.79 at 1.0727.
- Confluence check. The FVG (1.0734-1.0741) overlaps the 0.62-0.705 portion of the band almost exactly. Array plus OTE plus discount: the setup is valid.
- Entry and stop. Limit at 1.0734 (the 0.705 touch inside the gap), stop at 1.0705, just beyond the sweep wick - 29 pips of risk.
- Targets. -0.27 projects 1.0812 (first partial, about 2.7R), -0.62 projects 1.0840 (about 3.6R), and -1 projects 1.0870 for a runner if higher-timeframe buy-side liquidity sits near it.
Notice what did the work: the sweep defined the range, displacement validated it, the array provided the entry, and the negative extensions pre-planned the exits. The fib itself made no prediction - it converted one well-chosen swing into a complete map of entry, invalidation, and targets.
That is the correct mental model for Fibonacci in ICT: a coordinate system for the dealing range. Master the anchoring rules and the handful of levels above, and the tool stops being decoration and starts being the framework that prices your risk on every setup.
Frequently Asked Questions
What Fibonacci settings does ICT recommend?
Strip the tool to 0, 0.5, 0.62, 0.705, 0.79, and 1 for retracements, then add -0.27, -0.62, -1, and -2 for projections. Delete 0.236, 0.382, and 0.618 defaults. Label 0.5 as equilibrium and 0.62-0.79 as the OTE band so the premium/discount read is instant on any chart.
Why does ICT use 0.705 instead of the 0.618 golden ratio?
0.705 is the midpoint of the 0.62-0.79 OTE band, chosen for its position deep in discount rather than for any golden-ratio property. It buys roughly 30% of the range as stop distance while leaving the rest as reward. There is no solid evidence either ratio holds intrinsic edge in isolation; context supplies the edge.
Do you draw ICT Fibonacci from wick to wick or body to body?
Wick to wick. Wicks represent delivered price where orders actually transacted, so excluding them changes the range and shifts every level, including the OTE band. Body-based anchoring is a retail convention. The one wick-specific ICT tool is Consequent Encroachment - the 50% of a single wick - which is separate from range anchoring.
Does ICT Fibonacci work on any timeframe or market?
The geometry is fractal, so the same anchoring rules apply from monthly charts to one-minute charts, and across forex, indices, and crypto. Reliability improves when the higher timeframe sets the dealing range and bias while a lower timeframe times the OTE entry, and when entries align with active sessions rather than dead liquidity hours.
Related query paths
Where to go next, in the order the concepts build on each other:
- How to Draw a Dealing Range in ICT (Correctly) - the fib is only as good as the range you anchor it to; nail the range first.
- How to Draw Premium & Discount Zones (ICT Guide) - the value logic behind 0.5 equilibrium, in full.
- OTE Explained: The ICT Optimal Trade Entry Zone - a deep dive on the 0.62-0.79 band and how to trade it.
- Equilibrium vs OTE: The Right ICT Entry Level - when to act at 0.5 versus waiting for the deeper band.
- OTE Optimal Trade Entry: The Institutional Model vs. Retail Fibs - a longer treatment of the retail-versus-ICT fib split.
- CBDR & Standard Deviations: ICT Range Projection - how the -1/-2 extension logic powers ICT's session-range targets.
- Golden Pocket vs OTE Zone: How the Two Fib Bands Differ — how it connects to golden pocket vs ote.