
What Is the Central Bank Dealers Range (CBDR)?
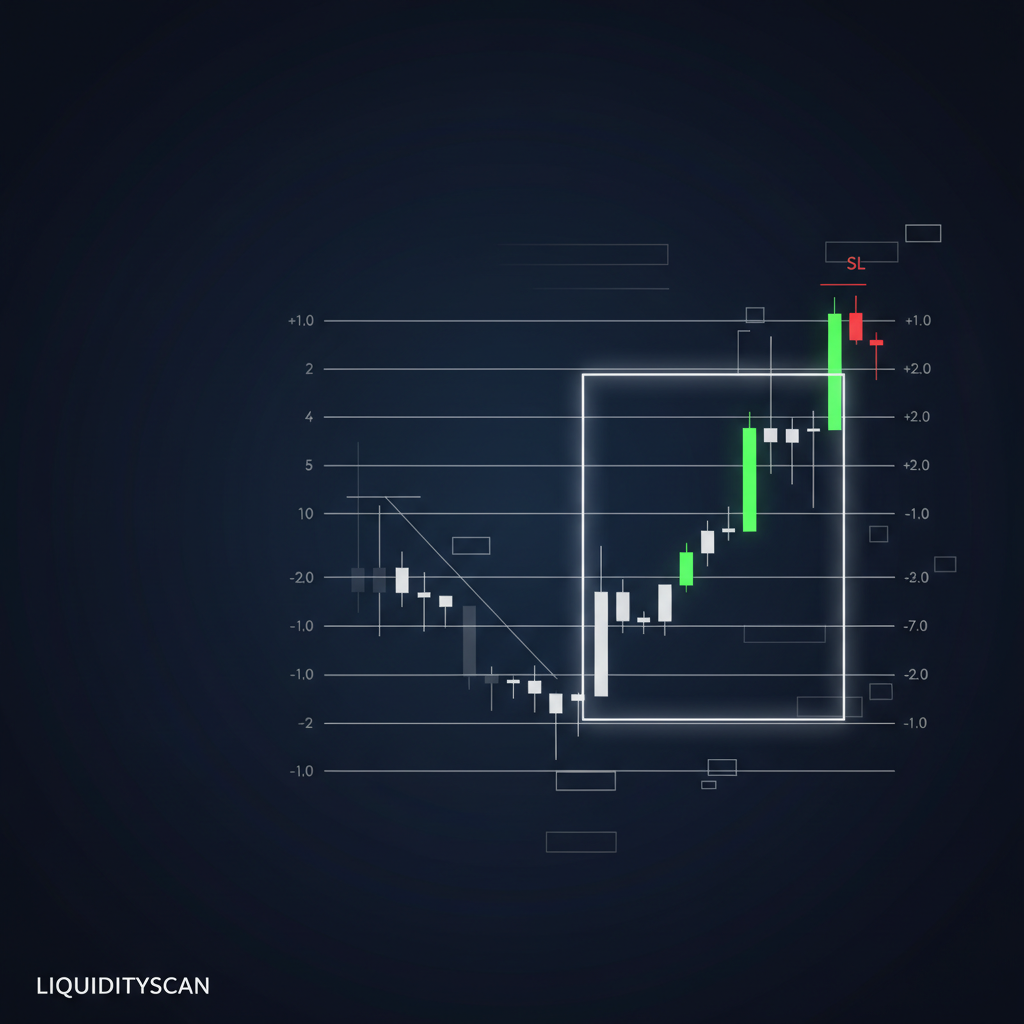
The central bank dealers range (CBDR) is a defined block of overnight price action that ICT traders measure and then extend into the coming session. The idea is simple: during a quiet late-day window, price consolidates in a tight box.
That box has a high and a low. The distance between them is your unit of measure. From it, you project standard-deviation levels above and below to estimate where price may travel once real volume returns.
The CBDR is not a signal on its own. It is a projection tool — a way to convert one measured range into a series of forward-looking targets that you then validate with structure and timing.
The CBDR Time Window
The CBDR is measured over a fixed late-day window, roughly 14:00 to 20:00 New York time. You box the highest high and lowest low inside that window, then extend the range forward.
The exact window matters less than consistency: keep it the same every day so your projections stay comparable. Session timing sits underneath all of this — if you need the broader map of when institutional activity clusters, that is covered separately in the kill-zone and macro-window guides linked below.
| Element | Definition | Example (illustrative) |
|---|---|---|
| CBDR window | Approx. 14:00–20:00 New York time | Fixed daily |
| Range high | Highest price inside window | 1.0850 |
| Range low | Lowest price inside window | 1.0820 |
| Range size (1 SD) | High − low | 30 pips |
| +2 SD target | High + (2 × range) | 1.0910 |
| −2 SD target | Low − (2 × range) | 1.0760 |
Standard Deviation Projections
Here the range becomes a ruler. Treat the full CBDR height as one standard deviation. From the range high, add multiples of that height upward; from the range low, subtract multiples downward.
So 1x above the high, 2x above the high, 3x above the high — and mirror the same distances below the low. Most sessions resolve within the 2x to 3x band, which is why those levels make natural first targets.
In my own plan I mark 2x above and 2x below as the primary objectives, then keep 3x as an extended target for trend days. If price hesitates at 1x, that often flags a weak expansion. LiquidityScan surfaces this kind of measured-move context so the levels are not just lines on your screen.
Keep the projection honest: the range is only useful when the overnight box was genuinely quiet. A wide, choppy CBDR inflates every deviation and produces targets too far away to trust.
The Asian Range and the "Flout"
The Asian range is the consolidation formed during the Asian session, and it can be projected the same way as the CBDR. When you prefer that window, you swap one measured box for another and rebuild your deviation ladder from it.
The "flout" refers to a flat, low-range overnight period — a compressed box where the CBDR barely moves. A tight flout produces small deviation units, which can cluster your targets uncomfortably close together.
Cross-check both readings against the Average Daily Range. If your 2x deviation already exceeds a typical daily move, the range was too wide to project cleanly, and you should stand down.
How to Use CBDR Projections in a Trade Plan
Anchor everything to the New York midnight open. Price opening above or below the midnight level, relative to your deviation ladder, gives you a directional lean before the session expands.
My sequence is plain: box the CBDR, plot 1x–3x each side, note the midnight open, then wait for market structure to confirm one direction. Projections tell you where; structure tells you whether. Use the market-structure framework below to filter which deviation targets you actually trade toward.
Enter on a structural signal in the direction of the lean, target the nearest untouched deviation, and manage risk against the opposite side of the box. The deviations are objectives, not entries.
Journal every projection versus where price actually finished. Over a few weeks you will learn which deviation your instrument respects most often, and that historical hit-rate becomes the real edge — the projection is only a hypothesis until your own data confirms how far this market tends to run.
Limitations
Skip CBDR projections on high-volatility and scheduled-news days. Central-bank rate decisions and major data releases distort the overnight box, and the resulting deviations point nowhere useful.
The technique assumes a normal, liquid overnight session. On thin holidays, month-end rebalancing, or during a rate announcement, the measured range is not representative. For scheduled economic and settlement calendars, exchange resources such as CME Group trading hours help you flag the sessions to avoid.
Finally, no projection replaces confirmation. If structure disagrees with your deviation lean, trust structure and let the target go.
Frequently Asked Questions
What time window defines the CBDR?
The central bank dealers range is measured over a fixed late-day window, roughly 14:00 to 20:00 New York time. You box the high and low inside that window and extend it forward as your standard-deviation unit.
How do you project standard deviations from the CBDR?
Treat the full range height as one standard deviation. Add multiples of it above the range high and subtract the same multiples below the low, giving 1x, 2x, and 3x targets on each side.
When should I avoid CBDR projections?
Skip them on high-volatility and scheduled-news days such as rate decisions or major data releases. The overnight box is distorted, so the deviations lose their predictive value.
Related query paths
Build the timing and structure context that makes CBDR projections reliable.
- ICT Kill Zones: A Pro Trader's Framework — session timing context behind the window.
- ICT Macro Times: The 20-Minute Windows — intraday timing for when deviations get hit.
- The Ultimate ICT Market Structure Framework — bias filter to confirm which projections to trade.