
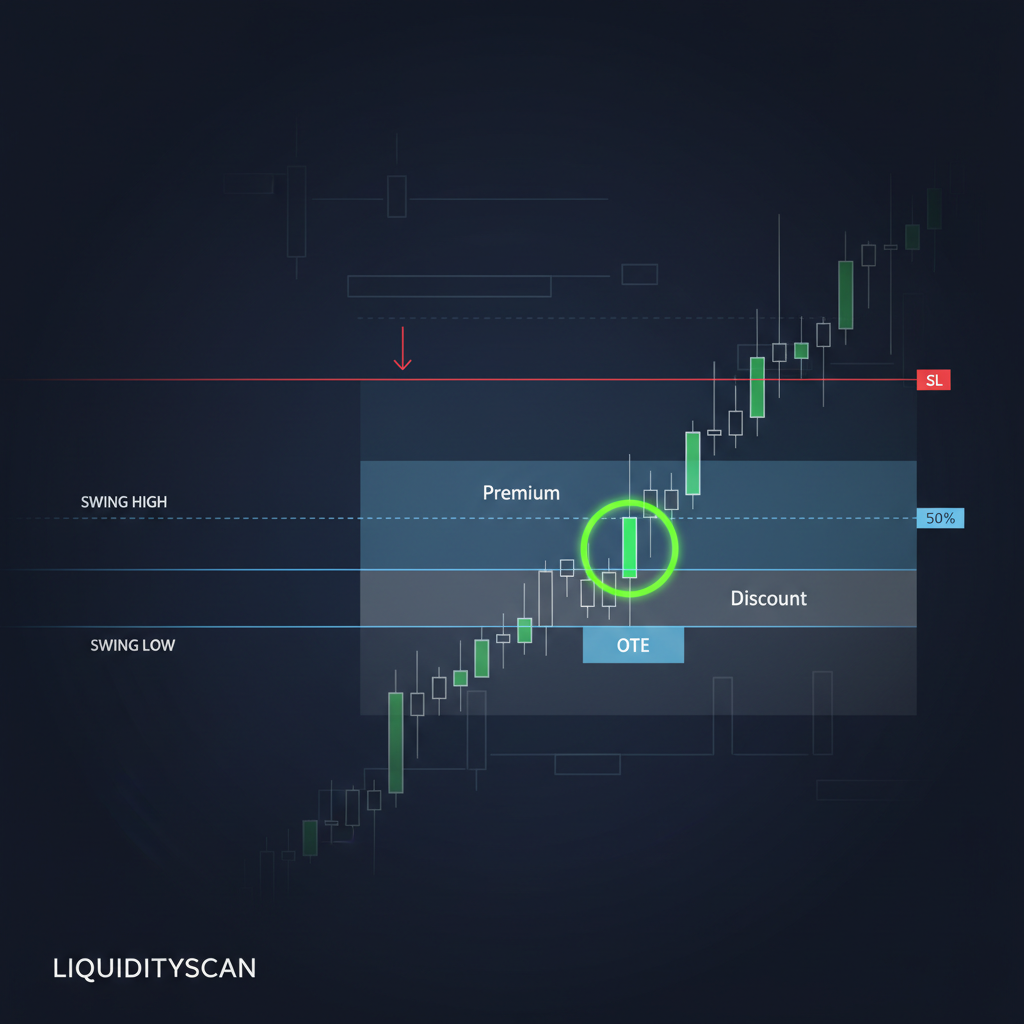
Draw a dealing range by connecting a confirmed swing low to a confirmed swing high (or the reverse) where each point swept liquidity before price reversed. The low must have taken sell-side liquidity; the high must have taken buy-side liquidity. That two-anchor structure becomes the ruler you measure premium, discount, equilibrium and OTE against. If either anchor is arbitrary, every zone you derive from it is noise.
What makes a swing point valid for a dealing range
A valid anchor is a swing that raided resting liquidity and then reversed with intent. Not the highest candle on your screen — the high that ran stops above a prior high or a cluster of equal highs, then failed. Same logic inverted for the low.
The distinction matters because the algorithm delivers price between pools of liquidity, not between random extremes. When your two anchors are both liquidity events, the range you draw maps onto how price is actually being delivered. When they are just visual highs and lows, you are measuring against nothing.
Three checks before you commit an anchor:
- It took liquidity. The high traded through a previous high or equal highs; the low traded through a previous low or equal lows.
- It reversed with displacement. A sharp, one-sided move away from the level — ideally leaving a fair value gap — tells you the raid was mitigated, not casual.
- It is unmitigated at the timeframe you trade. The swing still frames current price; it hasn't already been fully traded back through.
Step by step: drawing the range
Pick your timeframe first, then find the most recent pair of opposing liquidity raids. The range is the distance between them.
- Identify the confirmed low. Locate the most recent swing low that swept sell-side liquidity and reversed up with displacement. That is your range low.
- Identify the confirmed high. Locate the swing high that swept buy-side liquidity and reversed down with displacement. That is your range high.
- Anchor the two points. Draw your boundaries at those exact levels. The order they formed sets your directional context — low first then high implies a bullish delivery leg; high first then low implies a bearish one.
- Mark equilibrium. Split the range at 50%. Everything above is premium, everything below is discount.
- Overlay OTE. Inside the discount half of a bullish range, the 62%–79% retracement zone is your optimal trade entry band; mirror it in the premium half for shorts.
How the range feeds premium, discount and OTE
The range exists to tell you whether price is expensive or cheap relative to institutional delivery. In a bullish dealing range you want to buy in discount — below equilibrium — not chase in premium. In a bearish range you sell in premium.
Equilibrium is the pivot. Price trading back to the 50% level after an expansion is the algorithm rebalancing before the next leg, and it's often where a decision gets made. OTE sharpens that further: the 62%–79% pocket is where you get the deepest discount (or richest premium) that still respects the range direction, which is what keeps your stop tight and your reward asymmetric.
| Zone | Location in range | Bias use |
|---|---|---|
| Premium | Above 50% | Look for shorts in a bearish range |
| Equilibrium | 50% | Decision pivot / rebalance |
| Discount | Below 50% | Look for longs in a bullish range |
| OTE | 62%–79% retrace | Precision entry inside the favoured half |
When a dealing range is invalidated
A range is invalidated the moment price closes decisively beyond one of its anchors, because that close creates a new liquidity event and a new extreme to measure from. A wick through a boundary that gets rejected is a sweep — that can extend the range or confirm the opposite pool. A body close through it is a structural break.
Practical rules I hold to:
- Break of the range high with displacement in a bullish context — the old range is consumed; redraw from the new confirmed low to the new high.
- Break of the range low in a bullish context — the low failed to hold; that's often a shift in delivery and the range no longer frames your bias.
- Time decay. Once price has expanded well beyond the range and left it behind, stop trading premium/discount off a stale structure. Rebuild on the timeframe you're actually executing.
The redraw is not a failure — it's the point. Dealing ranges are rolling. Each time a new liquidity raid confirms, you re-anchor so your premium and discount always reflect the current delivery, not last week's.
Frequently Asked Questions
Can a dealing range use the highest and lowest candle on the chart?
Only if those extremes actually swept liquidity. A visual high or low that never ran stops is a weak anchor. Prioritise the swing that raided a prior high or low and reversed with displacement, even if a taller candle sits nearby.
What timeframe should I draw the dealing range on?
Draw it on the timeframe that frames your trade. Higher timeframes give you the dominant range and bias; you then nest a lower-timeframe range inside discount or premium for the entry. Both should be anchored to liquidity, just at different scales.
Does the range have to go low-to-high?
No. Anchor low-to-high when delivery is bullish and high-to-low when it's bearish. The order the two liquidity raids formed sets the directional context and tells you which half to hunt entries in.
Related query paths
Once your range is drawn, these are the natural next steps to trade it well.
- PD Array ICT Explained: A Trader's Guide to Premium & Discount — turn range halves into a ranked hierarchy of entry zones.
- OTE Explained: The ICT Optimal Trade Entry Zone — the precise retracement band inside your discount or premium.
- What Is a Liquidity Sweep? — confirm the raids that make your anchors valid.
- What Is Market Structure in ICT? — the structural context your range sits inside.
- Internal vs External Liquidity: An SMC Trader's Guide — understand which pools your boundaries are actually engineering.
- Equilibrium vs OTE: The Right ICT Entry Level
- How to Draw Premium & Discount Zones (ICT Guide)
- What Are the 4 Trading Zones? ICT Dealing Range