
How Do You Scan for Premium and Discount Zones Automatically?
You don't scan for a premium and discount zone directly. Premium and discount are a location derived from a dealing range and its 50% equilibrium, so the automated workflow is: scan for the actual setups, then filter each one by which half of the range it sits in — buy discount, sell premium.
That distinction matters because there is no honest one-click "premium and discount zone scanner." A range must be anchored to a valid swing high and swing low before premium or discount even exists. What a scanner can automate is the surrounding context — bias, per-timeframe alignment, and the price-delivery arrays you judge by location.
What Are Premium and Discount Zones?
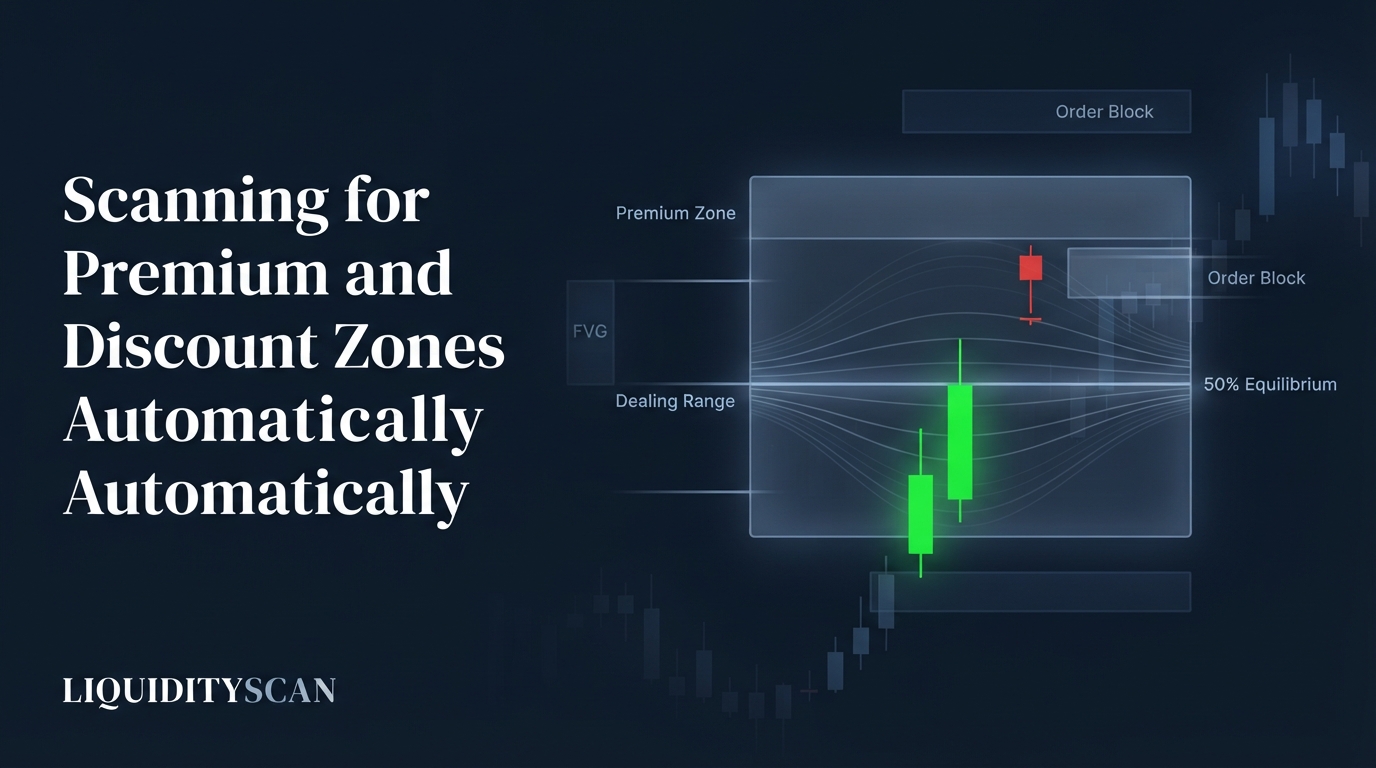
A premium and discount zone is one half of a Dealing Range split at its midpoint. Draw the range wick-to-wick between a confirmed swing high and swing low, then mark the 50% level — the Equilibrium. Everything above equilibrium is premium (expensive); everything below is discount (cheap).
The logic is institutional: in a bullish leg you want to buy at a discount, so longs only make sense below equilibrium. In a bearish leg you want to sell at a premium, so shorts only make sense above it. Price trading back to equilibrium is the neutral fair-value pivot — not a discount, not a premium, and rarely where you want to commit size in either direction.
- Discount (0–50%): the lower half of the range — where you look to buy in a bullish context.
- Equilibrium (50%): the fair-value midpoint that divides the two halves.
- Premium (50–100%): the upper half — where you look to sell in a bearish context.
The subtlety is that premium and discount are relative to whichever range you anchored. A pullback can be a discount on the 4H dealing range while still sitting in premium on the 1H range. Location is only as trustworthy as the swing points you chose, which is exactly why the anchor — not the scan — is the part that needs your judgment.
Why Automating Premium and Discount Scanning Matters
Checking premium versus discount by hand does not scale. For every pair you have to identify the relevant swing high and low, draw the range, mark the 50%, and then decide whether the current setup sits in the correct half for its direction. Repeat that across 400+ instruments and multiple timeframes and it becomes impractical to do before the setup is gone.
Worse, doing it manually invites confirmation bias. When you already like a long, it is easy to pick a swing low that conveniently places price "in discount." Automating the context — the bias read and the array location — forces a consistent frame and lets you reject the setups that fail location instead of rationalizing them.
The realistic goal is not a magic button that outputs "discount zone found." It is coverage and speed: surface the candidate setups across the whole market, attach an objective bias and per-timeframe read to each, and let you make the location call in seconds rather than minutes.
There is also a freshness cost. Premium and discount are only actionable while price is still in the correct half and the array is unmitigated. By the time you hand-draw ranges across a watchlist, the best-located setups have often already been tapped. Automating coverage means the retest alert reaches you while the array is still fresh.
How LiquidityScan Surfaces Premium and Discount Context
LiquidityScan does not ship a standalone premium and discount zone scanner, and you should be suspicious of any tool that claims to — the range anchor is a judgment call. What it does provide is the context around that judgment, through four real surfaces.
1. X-Ray per-coin dossier: where price sits, per timeframe
Type a symbol into X-Ray and you get a live per-coin dossier aggregating everything the platform already knows about that pair. Its Verdict & Bias card shows a LONG/SHORT/NEUTRAL read with a confidence percentage, plus macro / mid / micro alignment and a per-timeframe bias row. That is the directional context location depends on — a discount only matters if the draw is up.
2. ICT Bias scanner: directional bias across pairs
The ICT Bias scanner flags each market bullish or bearish from the last closed candle's break of the prior candle's range (inside the range = ranging, no signal). Running it across pairs gives you the market-wide directional filter that decides whether you are hunting discounts to buy or premiums to sell in the first place.
3. Scanner Studio: build a location-aware custom scan
The no-code Scanner Studio lets you combine an engine — say an OB+ order block or a nested FVG — with context filters like killzone, session, asset class, 24h-volume floor, and day-of-week, joined by AND/OR logic and optional higher-timeframe wrappers. Require a higher-timeframe bullish bias leg alongside a lower-timeframe array, and the scan surfaces only setups already in a supportive context — most of the premium/discount filter.
4. OB+ / FVG scanners: the arrays you judge by location
The OB+ (liquidity-confirmed strong order block) and nested FVG+/FVG++ scanners surface the price-delivery arrays themselves — fresh, unmitigated zones with a retest proximity alert. These are the PD Array objects you then grade by location: an unmitigated bullish OB sitting in discount is a very different proposition from the same OB sitting in premium.
None of these outputs an entry, stop, or target (except Super Engulfing's geometric RR ladder), and none draws your dealing range for you. They surface the setups and the bias so you can apply the premium/discount test quickly and consistently.
The Workflow: Surface Setups, Then Filter by Location
Put together, automated premium and discount scanning is a three-step loop, not a single query:
- Surface candidate setups. Run the OB+ or FVG scanner (or a Studio scan) market-wide to get fresh, unmitigated arrays across every liquid pair. This is the coverage step no manual process can match.
- Check premium/discount context. Open the candidate in X-Ray or read the ICT Bias flag. Confirm the higher-timeframe draw supports the direction, then anchor the dealing range to a valid swing high and low and mark equilibrium.
- Take only correct-half setups. Keep bullish arrays sitting in discount and bearish arrays sitting in premium. Discard the rest — a good order block in premium during a bullish leg is a location failure, no matter how clean the candle looks.
The scanner does steps 1 and most of 2; you own the range anchor and the final location call. That division is the honest version of "automatic" — the machine handles coverage and context, the trader handles the one judgment that can't be trusted to a fixed rule.
A Worked Example
Say BTCUSDT is in a bullish 4H leg. The higher-timeframe dealing range runs from a swing low at 60,000 to a swing high at 68,000, so equilibrium sits at 64,000. Discount is anything below 64,000; premium is above it.
The OB+ scanner surfaces a fresh bullish order block at 61,800, formed as an impulse took sell-side liquidity below a prior low. You open BTCUSDT in X-Ray: the Verdict card reads LONG with macro and mid aligned bullish, and the 4H ICT Bias flag is bullish. That order block sits well below the 64,000 equilibrium — clean discount, correct half for a long. It passes the filter.
Now compare a second array: an OB+ at 66,500. Same pair, same bullish bias — but 66,500 is above equilibrium, deep in premium. Buying there means paying up in the expensive half, so it fails the location test and you skip it even though the order block is valid. Same scanner output, opposite decision, driven by where each array sits relative to the 50% level.
Notice what the scan did and did not decide. It found both order blocks, confirmed both sat under a bullish bias, and alerted you on each retest. What it could not do was tell you 61,800 was a discount and 66,500 a premium — that required the 60,000–68,000 range and its 64,000 equilibrium, which you anchored by hand.
Move the swing low up to 63,000 and 61,800 falls outside the range entirely; move the swing high and the equilibrium shifts with it. The scanner gave you speed and coverage; the location verdict stayed yours, exactly as it should.
What Premium and Discount Scanning Needs vs. Which LiquidityScan Surface Provides It
| What the task needs | LiquidityScan surface that provides it | What you still do manually |
|---|---|---|
| Directional bias (buy discount vs sell premium?) | ICT Bias scanner + X-Ray Verdict card | Decide which timeframe's bias is your reference |
| Per-timeframe alignment (is the draw supportive?) | X-Ray macro/mid/micro alignment row | Interpret conflicting timeframes |
| Candidate setups / PD arrays to grade | OB+ and nested FVG+/FVG++ scanners | Nothing — surfaced automatically with retest alerts |
| Location-aware market-wide scan | Scanner Studio (engine + HTF bias leg + context filters) | Design the rule; still confirm the range |
| The dealing range anchor + equilibrium | None — not automated | Anchor wick-to-wick to valid swings, mark 50% |
| The final premium/discount verdict | None — your call | Confirm the array is in the correct half |
Be clear-eyed about the honest limits of any premium and discount zone scanner. There is no dedicated one-click version here or anywhere credible, because the range anchor is subjective and any tool that hard-codes it will silently mislocate premium and discount whenever it picks the wrong swings.
LiquidityScan surfaces bias, alignment, and arrays; it does not draw your dealing range or output entries, stops, or targets, and it publishes no win rates. Signals detect on closed candles only, so what you filter is stable — but the premium and discount call still depends on the swings you choose. Treat these surfaces as context for a disciplined location check, not a verdict to trade blind.
Frequently Asked Questions
Is there a one-click premium and discount zone scanner?
No credible one exists, and LiquidityScan doesn't claim one. Premium and discount only exist relative to a dealing range you anchor to specific swing points, and that anchor is a judgment call. A tool can automate bias and array coverage, but the range — and therefore the exact premium/discount split — is yours to confirm.
How do I know which dealing range to use for premium and discount?
Match the range to your trade's timeframe and draw it wick-to-wick between the most recent confirmed swing high and swing low that frame the current leg. A 4H setup uses the 4H range. If higher and lower timeframes disagree, the higher-timeframe range usually governs the bias, and you locate entries within it.
Can Scanner Studio filter setups by premium or discount directly?
Not as a literal "premium/discount" toggle, since that depends on a range anchor. But you can approximate it: require a higher-timeframe bullish bias leg alongside a lower-timeframe order block or FVG, so the scan only surfaces arrays already in a supportive directional context. You then confirm the location by eye.
Does buying in discount guarantee the trade works?
No. Location is a filter that improves your context, not a guarantee. Buying in discount during a bullish leg means paying a better price if the draw plays out, but the higher-timeframe bias can still be wrong and the range can still break. Premium and discount improve trade selection; they don't remove risk.
Related query paths
Build the concept from the ground up — the dealing range and equilibrium that define premium and discount, then the arrays and scanning that apply them:
- How to Draw Premium & Discount Zones (ICT Guide) — the manual method these scans automate around.
- How to Draw a Dealing Range in ICT (Correctly) — anchor the range right or every location call is wrong.
- Equilibrium ICT: The 50% Level Explained — the midpoint that splits premium from discount.
- What Are the 4 Trading Zones? ICT Dealing Range — how the range subdivides beyond a simple 50% cut.
- PD Array ICT Explained: A Trader's Guide to Premium & Discount — the arrays you grade by location.
- Order Block Scanner: Real-Time OB & FVG — how the array coverage step actually runs.
- How to Catch Asian-Range Sweeps Every Session — a related angle on asian range sweep scanner.