
What Is Equilibrium in ICT?
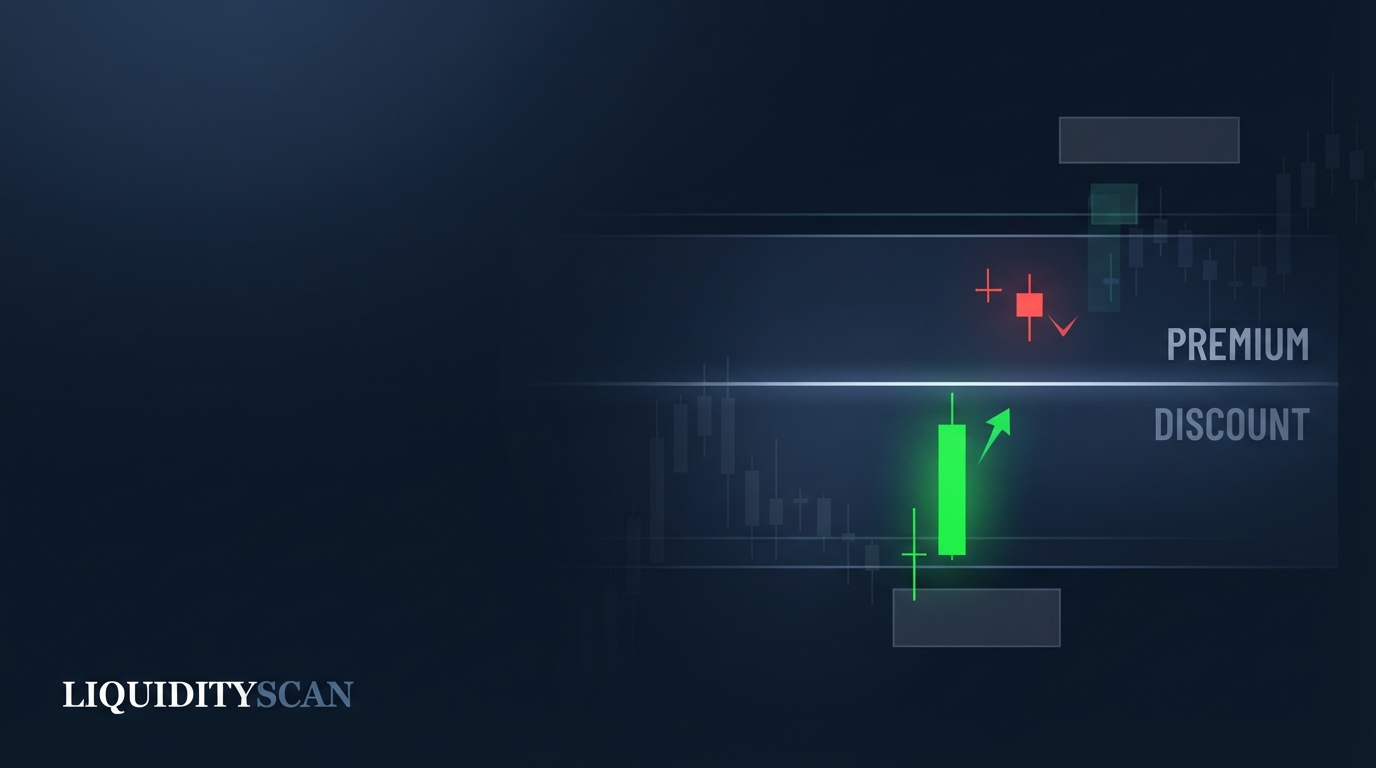
Equilibrium in ICT is the exact 50% level of the current dealing range — measured wick-to-wick from swing low to swing high. It marks fair value: everything above it is premium (where institutions sell), everything below it is discount (where institutions buy).
The concept comes straight from how large participants have to transact. A fund cannot buy at any price it likes; it needs to accumulate where price is cheap relative to the range it is trading in, and offload where price is expensive. The midpoint of the range is the neutral reference that defines "cheap" and "expensive" objectively, without indicators or opinion.
That single line reorganizes your chart. Instead of asking "is this level support or resistance?", you ask a sharper question: is price in premium or discount relative to the range that matters? Longs in premium and shorts in discount fight the side where institutional interest is thinnest — which is why equilibrium works best as a hard filter, not a trade signal.
Why Institutions Buy Discount and Sell Premium
The value logic is mechanical, not mystical. Institutional order flow needs counterparties. Below equilibrium, retail sellers are capitulating, stops under old lows are being cleared, and passive buy interest can absorb size without moving price against the buyer. Above equilibrium, the mirror is true: late buyers chase, stops above old highs get purged, and large sellers can distribute into that demand.
This is the same asymmetry you see in ICT's Power of 3 (PO3) template — accumulation at the lows of a range, manipulation through one side, distribution into the other. Equilibrium is the dividing line of that cycle.
It also explains why PD arrays are graded by location: an Order Block sitting in deep discount within a bullish range is a fundamentally different proposition from the same candle formation printed in premium.
Two practical consequences follow:
- Direction filter. In a bullish dealing range, you only hunt longs while price trades below equilibrium. In a bearish range, you only hunt shorts while price trades above it.
- Target logic. A long entered in discount has room to travel through fair value toward premium liquidity. A long entered in premium is buying into the zone where distribution happens — poor risk-to-reward by construction.
How to Anchor Equilibrium: Drawing the Dealing Range Correctly
Anchoring errors are the number one reason equilibrium "doesn't work" for traders. The level is only as good as the range it bisects, so the procedure matters.
Step 1 — Identify the current dealing range
The dealing range is the span between the most recent significant swing low and swing high that price is actively trading inside. "Significant" means the swings that took liquidity: the low that swept sell-side before the rally, the high that swept buy-side before the drop. A three-candle fractal that nobody's stops sat under is not a range boundary.
Step 2 — Measure wick-to-wick
Anchor from the extreme wick of the swing low to the extreme wick of the swing high — not candle bodies. Liquidity is engineered at the extremes; the wick is where stops were actually filled, so the wick defines the true edge of the range.
Body-to-body anchoring shifts equilibrium by the full wick length and can flip a discount reading into premium on volatile pairs.
Step 3 — Confirm the range is current
Ask one question: has price broken either boundary with displacement since the range formed? If yes, that range is dead and a new one is being built. Equilibrium drawn on an expired range is a random line.
This is the single most common failure mode — a trader anchors a beautiful range from three weeks ago, price has since printed a Break of Structure (BOS) beyond it, and every "discount" reading afterward is fiction.
Step 4 — Plot 50% and label the halves
Use a Fibonacci retracement or a plain 50% tool from low to high. Above the midpoint is premium; below is discount. Many traders also mark the 25% and 75% quadrants — deep discount and deep premium — because the highest-quality institutional entries tend to cluster in the outer quartiles rather than just barely across the midline.
Equilibrium Is a Filter, Not an Entry
Equilibrium tells you which trades you are allowed to look for, not where to click buy. The level itself carries no order flow: there is no origin of institutional buying at 50% the way there is at an Order Block, and no inefficiency to rebalance the way there is inside a Fair Value Gap (FVG).
Treating the midline as a support/resistance entry is importing retail logic into an institutional framework.
The correct sequence is:
- Define the dealing range and bias (bullish range = looking for longs).
- Wait for price to trade into the correct half — discount for longs, premium for shorts.
- Only then hunt a PD array inside that half: an Order Block, FVG, breaker, or the Optimal Trade Entry (OTE) zone at the 62–79% retracement.
- Demand a local confirmation — a sweep of a minor low plus displacement back in your direction — before executing.
That said, price does behave in observable ways around the midpoint, and knowing them keeps you from panicking mid-trade. Equilibrium acts as a consolidation magnet: after an expansion leg, price frequently returns to the 50% region and chops there while the market rebalances — the "return to fair value" phase.
On retraces, it is usually the first meaningful reaction level: algorithms that bought discount begin scaling around fair value, so a retracement often stalls or produces its first bounce near 50% before deciding whether to reach deeper into the range. A stall at equilibrium is information; it is not, by itself, an entry.
Equilibrium vs Consequent Encroachment: Same Math, Different Object
Both are 50% measurements, which is why traders conflate them. They apply to entirely different structures and serve different jobs.
| Attribute | Equilibrium (EQ) | Consequent Encroachment (CE) |
|---|---|---|
| Measured on | The dealing range (swing low to swing high) | A single Fair Value Gap or wick |
| What it splits | Premium from discount | The upper and lower half of the gap |
| Typical scale | Hundreds of pips / percent-scale moves | The height of one imbalance, often minutes-to-hours of price |
| Primary use | Directional filter for the whole trade idea | Precision fill level and invalidation cue within an FVG |
| Reaction expectation | Consolidation magnet, first-reaction zone | Price should respect CE if the gap is strong; trading through it weakens the array |
The two nest naturally: a bullish setup might require price in the discount half of the 4H dealing range (equilibrium filter), entering at the Consequent Encroachment of a 15-minute FVG inside that discount zone (execution level). One is strategy-level, the other is trade-management-level.
Equilibrium Across Timeframes and When the Range Redefines
Every timeframe carries its own dealing range, so nested ranges produce nested equilibriums. A weekly range has a 50%; inside its discount half, a daily range forms with its own 50%; inside that, a 1-hour range does too. These readings will regularly disagree — price can sit in 1H premium while parked in deep weekly discount.
The resolution rule is simple: the higher-timeframe equilibrium dominates. HTF discount plus LTF premium is not a conflict; it is a description of a pullback.
The weekly discount defines the campaign (institutions accumulating longs), while the 1H premium is merely the local retracement you wait to resolve — ideally back into 1H discount — before entering in the weekly direction. This is the same top-down logic ICT applies to bias generally: HTF sets permission, LTF sets timing.
Ranges also die, and equilibrium must move with them. When price breaks the dealing-range high with displacement — a genuine BOS, not a wick-poke — the old range is finished. The new dealing range typically runs from the last significant higher low (the origin of the breaking leg) to the new high, and equilibrium re-anchors to that span.
Practically, every confirmed BOS is a re-anchor event. A trader who keeps yesterday's midline after today's structural break is filtering trades against a market that no longer exists. Some traders keep the prior HTF range on the chart in faded color for context, but the actionable equilibrium is always the current one.
Worked Example: A BTCUSDT Dealing Range With Concrete Levels
Take a 4-hour BTCUSDT sequence. Price sweeps sell-side at 58,400 (wick low), displaces upward, and rallies to 63,200 (wick high), taking out a cluster of equal highs before stalling. That sweep-to-sweep span is the current dealing range: 4,800 dollars tall.
- Equilibrium: 58,400 + (4,800 × 0.5) = 60,800.
- Discount: below 60,800. Premium: above 60,800.
- Deep discount (lower quartile): below 59,600.
The range is bullish — it was created by a displacement leg up after a sell-side purge — so the filter says longs only, and only below 60,800.
Price retraces from 63,200, stalls briefly at 60,850 (the first-reaction behavior at fair value), then continues into 60,000, tapping a 4H Order Block spanning 59,800–60,150 that sits in discount and overlaps the OTE band of the leg.
A 15-minute sweep of a minor low at 59,920 followed by displacement up through short-term structure gives the confirmation. Entry near 60,050, stop under the OB at 59,700, first objective the buy-side above 63,200 — roughly a 9R geometry on paper before management.
Now the re-anchor: price breaks 63,200 with a strong 4H close and runs to 64,900. The old equilibrium at 60,800 is obsolete. The new dealing range runs from the higher low at 61,000 (origin of the breaking leg) to 64,900, putting the new equilibrium at 62,950. Any long idea now requires price back below 62,950 — not below the dead 60,800 line.
If you scan multiple pairs, tooling that tracks structure shifts helps here; LiquidityScan's market-structure and order-block scanners flag the BOS events that tell you a range — and therefore its equilibrium — has redefined.
Common Equilibrium Mistakes That Break the ICT Model
Most equilibrium failures trace back to a handful of repeatable errors:
- Static EQ on an expired range. The range broke, the trader didn't re-anchor, and every premium/discount reading since is measuring a ghost. Re-check range validity every time a boundary is tested.
- Treating equilibrium as support/resistance. Buying "the bounce off 50%" with no PD array and no confirmation is a coin flip dressed as a concept. The midline filters; arrays and displacement enter.
- Body-anchored ranges. Ignoring wicks shifts the midpoint and misclassifies trades near the line — precisely the trades where classification matters most.
- Anchoring insignificant swings. A range drawn between two minor fractals that never held liquidity produces an equilibrium no algorithm cares about. Boundaries should be sweeps.
- Ignoring the HTF midline. Shorting 1H premium into weekly discount is selling exactly where larger players are accumulating. Resolve nested equilibriums top-down, always.
- Demanding pinpoint reactions. Equilibrium is a zone of behavior, not a laser level. Expect reactions in the vicinity of 50%, and grade them by displacement quality rather than by tick-perfect touches.
Used correctly, equilibrium in ICT is the cheapest edge in the methodology: one honest line, anchored on the current dealing range, that removes an entire side of the market before you ever look for an entry. Everything else in the model — order blocks, FVGs, OTE — works better once it is applied only on the correct side of that line.
Frequently Asked Questions
Is ICT equilibrium the same as the 50% Fibonacci retracement?
Mathematically yes — both mark the midpoint of a measured swing. The difference is application: ICT anchors strictly wick-to-wick on the current dealing range defined by liquidity sweeps, and uses the level as a premium/discount filter rather than as a standalone retracement entry the way retail Fibonacci traders typically do.
Can price enter a trade exactly at equilibrium?
It can, but 50% is the lowest-conviction location in the range — fair value is where neither side has an edge. Most ICT traders require price to reach a PD array clearly inside discount (for longs) or premium (for shorts), often in the outer quartile, before considering execution. At exact equilibrium, patience beats participation.
What timeframe should I draw equilibrium on?
Draw it on the timeframe that defines your trade's dealing range — commonly daily or 4H for swing ideas and 1H for intraday — then respect the next timeframe up. The higher-timeframe equilibrium always dominates: it grants directional permission, while your execution timeframe's range only times the entry.
Does equilibrium work in strongly trending markets?
Yes, but the range redefines quickly. Each new Break of Structure creates a fresh dealing range from the latest protected swing, so equilibrium ratchets in the trend direction. In strong trends price may only retrace to shallow discount before continuing — which is why pairing equilibrium with OTE and displacement matters more there.
Related query paths
If equilibrium clicked, these are the natural next steps in the query journey — from anchoring the range correctly to executing inside the right half of it.
- How to Draw a Dealing Range in ICT (Correctly) — the anchoring procedure equilibrium depends on, in full detail.
- How to Draw Premium & Discount Zones (ICT Guide) — turning the 50% line into graded zones and quadrants on your chart.
- What Are the 4 Trading Zones? ICT Dealing Range — the quartile model that refines premium and discount into four actionable zones.
- PD Array ICT Explained: A Trader's Guide to Premium & Discount — the array hierarchy you hunt once price is on the correct side of equilibrium.
- Equilibrium vs OTE: The Right ICT Entry Level — how the 50% filter and the 62–79% entry zone divide the work.
- Consequent Encroachment: The 50% FVG Rule — the other 50% level in ICT, applied to a single Fair Value Gap.
- Fibonacci in ICT: Which Levels Actually Matter (and Why) — how it connects to fibonacci ict.