
What Is the London Close Kill Zone?
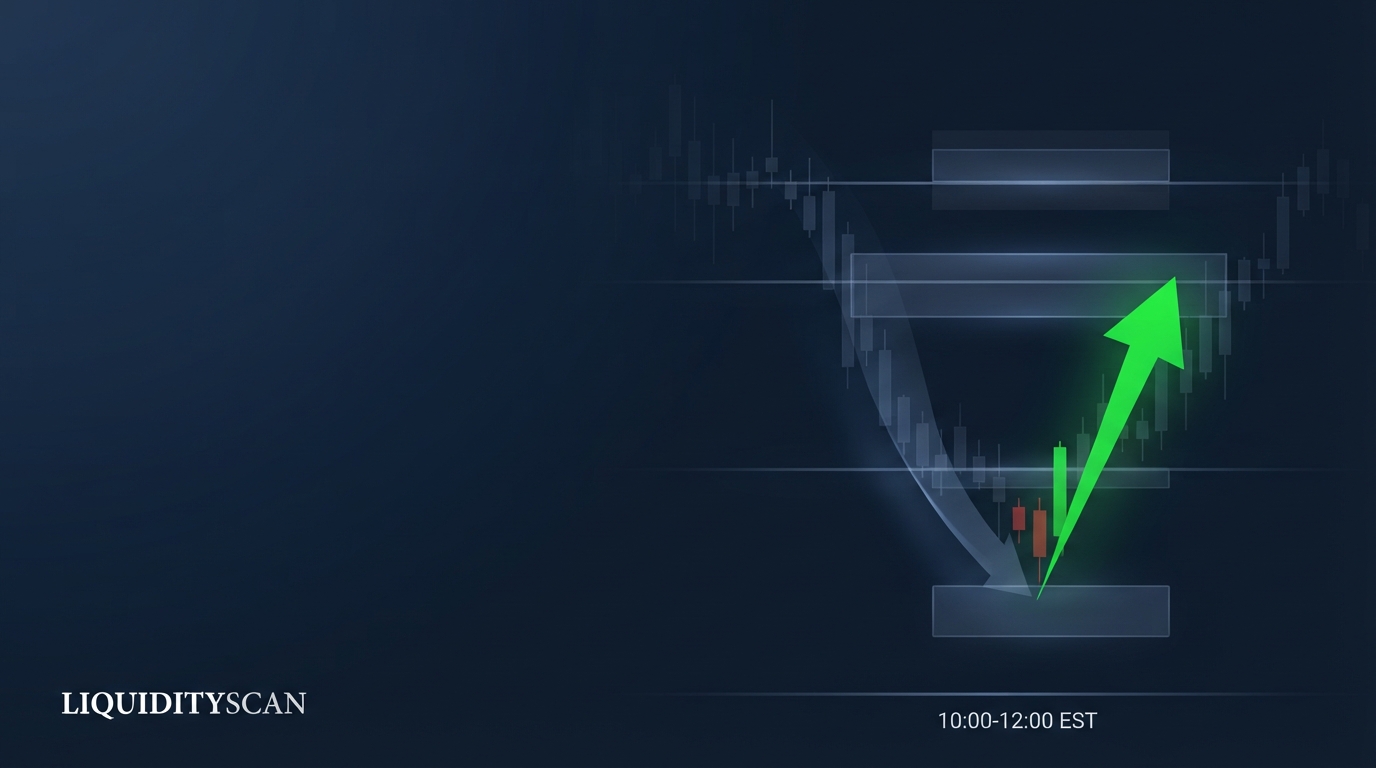
The London close kill zone is the window from 10:00 to 12:00 EST (15:00-17:00 London), when European desks square positions before their session ends. Its character is reversal: the New York AM move often stalls or reverses back toward equilibrium as London liquidity exits.
Unlike the morning kill zones, this is not a window built for fresh expansion. It is where an established intraday move gets faded. The Draw on Liquidity often flips from the session extreme back toward the middle of the day's range, or toward the opposite pool that was left untouched during the London and New York AM sessions.
When Is the London Close Kill Zone in EST and London Time?
The core window is 10:00-12:00 EST. Because London runs five hours ahead, that maps to 15:00-17:00 local time, ending at the 16:00 London fix and the 17:00 equities close. The FX 4pm London fix (11:00 EST) is the anchor: it is the largest scheduled rebalancing event of the day, and flow around it drives much of the reversal.
- 10:00-11:00 EST — early close window; the NY AM move begins to lose momentum as London desks reduce exposure.
- 11:00 EST (16:00 London fix) — concentrated benchmark flow; sharp, sometimes counter-intuitive moves.
- 11:00-12:00 EST — the reversion leg often develops as London books out fully.
These are clock times, not market times, so they shift with daylight saving. The US and UK do not change clocks on the same dates, so for two weeks each spring and autumn the EST-to-London offset breaks. Anchor the window to the 16:00 London fix, not a fixed EST number, during those transition weeks.
Why the London Close Is a Reversal Window
The mechanism is inventory, not indicators. European institutions that opened risk during the London and New York AM sessions do not want to carry it overnight into thin afternoon liquidity. As they flatten, the pressure that drove the morning trend is removed, and price drifts back toward the mean.
Two forces compound this. First, the London close kill zone often follows a completed New York AM move that has already reached its Draw on Liquidity — a prior session high, a Fair Value Gap (FVG), or an Order Block. With the target hit, the reason to continue is gone.
Second, the AM session frequently engineers liquidity at obvious highs or lows; the close window is when the opposite side gets taken.
So the typical sequence is: the NY AM pushes to a session extreme and sweeps the stops resting there, then between 10:00 and 12:00 EST that extreme is rejected and price reverts toward Equilibrium (the 50% of the day's dealing range) or toward the untouched pool on the other side.
Because the reversal is driven by desks closing books, it tends to be mean-reverting rather than trend-extending.
There is also a structural reason the reversion is clean. A trending day usually spends the morning building a one-sided dealing range with liquidity engineered on both edges.
The AM session runs one edge; the close window is the natural time for the algorithm to deliver price back toward the other edge, because that unfilled liquidity is now the path of least resistance. The desks squaring positions and the untapped pool point the same direction, which is why the fade so often works when both align.
London Open vs. London Close Kill Zone
These two windows share a name but trade in opposite spirit. The open is a manipulation-and-expansion window: it creates the day's move, often via a Judas Swing that fakes one direction before running the other. The close is a reversion window that unwinds part of that move. Trading the close with an open-session mindset is the most common error.
| Attribute | London Open Kill Zone | London Close Kill Zone |
|---|---|---|
| Window (EST) | 02:00-05:00 | 10:00-12:00 |
| Character | Manipulation, expansion | Reversal, reversion, profit-taking |
| Primary flow | Desks open risk, run stops | Desks close risk, square books |
| Typical move | Judas swing then trend leg | Fade of the AM extreme toward equilibrium |
| Best for | Continuation / breakout traders | Reversal / mean-reversion specialists |
| Draw on liquidity | Toward a fresh HTF target | Back toward mid-range or the opposite pool |
How to Trade the London Close Kill Zone Step by Step
The setup is a sweep-and-reclaim against the completed session move. You are not predicting a reversal from nothing; you are waiting for price to take liquidity at the session extreme inside the window, then reject it. Here is the procedure.
Step 1: Map the London and NY AM move before 10:00 EST
Mark the high and low of the combined London plus New York AM range. Identify which extreme was made most recently and where the obvious stops sit — equal highs, equal lows, or the session high or low itself. That extreme is your candidate liquidity target for the sweep.
Step 2: Define equilibrium and the opposite pool
Draw the 50% of that range: this is Equilibrium and your first, most conservative target. The opposite side's untouched liquidity (the pool that was not run during the AM) is the extended target. A reversion that reaches equilibrium is the base case; a full rotation to the opposite pool is the extended case.
Step 3: Wait for the sweep inside 10:00-12:00 EST
Let price trade into the session extreme during the window and take the stops there. No sweep, no trade. The liquidity grab is the trigger, because the desks fading the move need that liquidity to fill against. A move that reverses without first sweeping is lower quality and often just a pause.
Step 4: Confirm with a reclaim or MSS on the LTF
Drop to the 1-5 minute chart. After the sweep, wait for a Market Structure Shift back into the range — price reclaims the swept level and breaks the most recent internal structure point in the reversal direction, ideally on displacement that leaves a fresh FVG. That FVG or the Order Block behind the shift is your entry zone.
Step 5: Enter, stop, and target
Enter on the retrace into the FVG or order block. Place the stop just beyond the swept extreme — beyond the exact wick that took the liquidity, not at a round number. Target equilibrium first, then trail toward the opposite pool if momentum holds.
Because the stop sits past a swept level that has already done its job, the reward-to-risk on a clean London close kill zone fade is often favorable even with a modest win rate.
A practical refinement: scale the position at equilibrium. Reaching the 50% level is the highest-confidence part of the move because it is where most of the squaring flow is aimed.
Booking a portion there and trailing the remainder toward the opposite pool lets you bank the base case while keeping exposure to the full rotation on days when the reversion runs. If price stalls and consolidates at equilibrium rather than pushing through, treat that as the move completing and manage the runner accordingly.
A Worked Example on EURUSD
Say EURUSD runs up through the London and NY AM sessions, printing a session high of 1.0920 at 09:30 EST that clears a cluster of equal highs from the prior day. The session low sits at 1.0865, so equilibrium is 1.0892 (the 50% level).
- 10:20 EST — price pushes one last time to 1.0924, four pips above the session high, sweeping the buy-side stops resting above it. The London desks that were long begin unwinding into the 16:00 fix.
- 10:35 EST — on the 3-minute chart, price rejects 1.0924, trades back below 1.0920, and breaks the last internal higher-low at 1.0908 with a displacement candle that leaves a bearish FVG from 1.0912 to 1.0916.
- 10:48 EST — price retraces into the 1.0912-1.0916 FVG. Short entry at 1.0914, stop at 1.0927 (above the sweep wick), first target equilibrium at 1.0892.
- 11:30 EST — reversion reaches 1.0892 for the base target; the runner trails toward the session low pool at 1.0865.
The trade worked because time and price aligned: the sweep hit inside the close window, the reason for the AM uptrend (reaching the equal-highs draw) was spent, and the reversal targeted the unfilled side of the range. That is the London close kill zone in one sequence.
What Invalidates the Setup, and Common Mistakes
The close-window fade fails on strong trend days. When a high-conviction directional move is underway — driven by a macro theme or a data surprise — the AM move does not exhaust into the close; it continues through it.
The tell is that price fails to reject the swept extreme and instead consolidates tightly against it, then breaks further. If there is no rejection and no structure shift, there is no trade.
A second failure mode is the shallow reversion that never reaches equilibrium. Some days the close window produces only a minor pullback of 20-30% of the range before the trend resumes into the New York PM session.
This is why the sweep-and-reclaim structure matters more than the calendar: the window tells you when to look, but the market structure shift tells you whether the reversal has real participation behind it. Skipping confirmation to trade the clock is how the London close kill zone earns its lower-probability reputation.
- High-impact news — a release landing near or inside the window can override the reversion. Treat scheduled news as a hard filter, per standard ICT News Trading discipline, and stand aside rather than fade into it.
- Trading without the sweep — the most frequent error is anticipating the reversal before the session extreme is taken. The sweep is the setup; skip it and you are guessing.
- Using an open-session mindset — expecting expansion in a reversion window. If you are a continuation trader, the New York AM is your window, not the close.
- Ignoring the fix — forcing a fixed EST time during DST transition weeks instead of anchoring to the 16:00 London fix.
Honestly framed, the London close kill zone is a lower-probability window for continuation traders and a specialist's window for reversal traders.
Published discretionary results for session-based reversal fades vary widely by instrument and regime; illustrative win rates often sit in a rough 40-55% band with reward-to-risk carrying the edge, but that range is indicative, not a promise. Verify it on your own instruments by journaling every close-window sweep-and-reclaim and measuring the reversion to equilibrium versus your stop.
Frequently Asked Questions
Is the London close kill zone the same as the London fix?
No, but they overlap. The 16:00 London fix (11:00 EST) is a single benchmark-pricing event that sits inside the broader 10:00-12:00 EST close window. The fix concentrates rebalancing flow; the kill zone is the wider two-hour band around it where the reversal typically develops.
Can I trade continuation in the London close window?
Occasionally, on strong trend days when the AM move refuses to exhaust and pushes through the window. But that is the exception. The window's structural bias is reversion because desks are closing risk, so continuation trades there fight the dominant flow and carry lower odds than an AM entry.
What is the best timeframe for the entry?
Map the session range on the 15-minute or 1-hour chart, then execute on the 1-5 minute chart after the sweep. The higher timeframe defines the liquidity target and equilibrium; the lower timeframe confirms the market structure shift and gives a precise FVG or order block entry with a tight stop.
Does the London close kill zone work on crypto?
Partially. Crypto has no formal session close or 16:00 fix, so the reversion is weaker and less scheduled than in FX. However, the AM equity-session move on BTC and ETH still often fades into the US midday as spot desks square, so the sweep-and-reclaim logic can apply with lighter expectations.
Related query paths
Build out the surrounding time-and-price framework these fade setups depend on:
- ICT Kill Zones Complete Guide: A Pro Trader's Framework — the full session map that places the close window in context.
- The London Open Kill Zone Strategy: A Procedural Guide — the expansion window that creates the move you later fade.
- A Precise New York AM Kill Zone Strategy for ICT Traders — the AM move whose extreme the close window reverses.
- Liquidity Sweep Then MSS: Reversal Guide — the exact sweep-and-reclaim entry mechanic used here.
- Equilibrium ICT: The 50% Level Explained — the first target every reversion leg draws toward.
- The Ultimate Guide to DST Kill Zone Adjustments for ICT Traders — how to keep the window aligned across the clock-change weeks.
- Kill Zone vs Macro vs Silver Bullet: How ICT's Time Windows Nest — a related angle on kill zone vs macro vs silver bullet.