
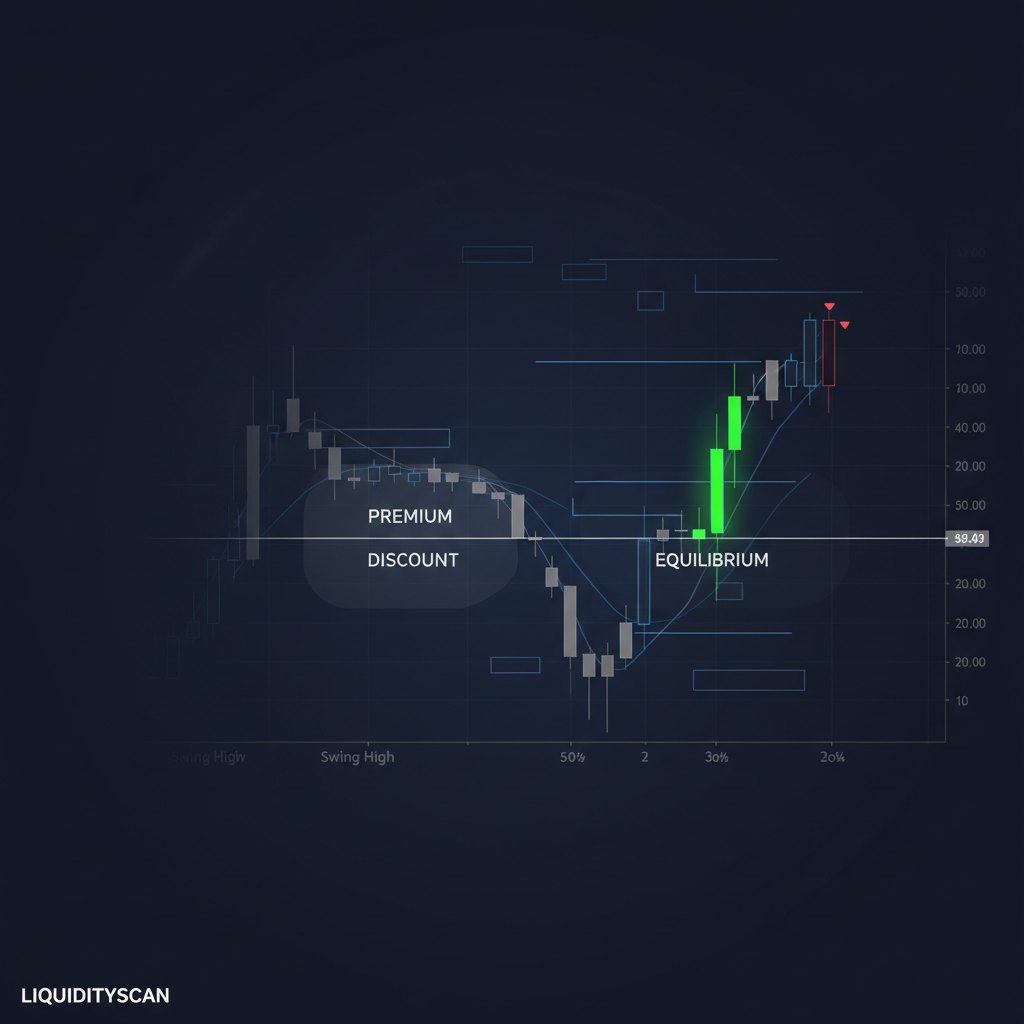
To draw premium and discount zones, mark the most recent significant swing high and swing low to define your dealing range, then plot the 50% level between them. Everything above 50% is premium (where you look to sell), everything below is discount (where you look to buy), and the midline itself is equilibrium. The whole method lives or dies on choosing the correct range, not on the arithmetic.
The four-step procedure to draw the zones
The process is mechanical once the range is chosen. Use a Fibonacci retracement tool or a simple range tool and follow this order.
- Identify the dealing range. Find the swing high and swing low that bracket the current price move. This is the leg the market is actively working within.
- Anchor the tool. In an uptrend, drag from the swing low up to the swing high. In a downtrend, drag from the swing high down to the swing low. Direction matters for reading, not for the math.
- Mark equilibrium at 50%. The midpoint is your equilibrium line. Price above it is expensive; price below it is cheap.
- Split premium and discount. Shade the upper half as premium and the lower half as discount. That is your bias map for entries.
A trader biased long waits for price to trade into discount before hunting entries. A trader biased short waits for premium. You are trying to sell high and buy low relative to the range the algorithm is delivering within.
Which range to use on each timeframe
Use the range that matches the decision you are making. Premium and discount are fractal, so a chart has several valid ranges at once. Match the range to the timeframe you trade the entry on, and let the higher timeframe set direction.
| Purpose | Range to draw | Reads for |
|---|---|---|
| Directional bias | Weekly / daily dealing range | Which half of the larger range price sits in |
| Setup framing | 4H / 1H swing range | Whether the pullback reached discount or premium |
| Entry precision | 15m / 5m range after a sweep | Fine-tuning entry inside the higher-timeframe zone |
The alignment that pays is when a lower-timeframe discount sits inside a higher-timeframe discount, and both agree with your bias. When the daily says discount and your 15-minute pullback also prints discount, that is a stacked read, not a coincidence.
The wrong-leg error that ruins the zone
Anchoring to the wrong leg is the single most common mistake, and it silently inverts your bias. If you drag your range across a leg that price has already broken out of, your equilibrium sits at a level the market has abandoned, and you end up buying premium while thinking you bought discount.
Three rules keep the anchor honest.
- Use the leg that got swept. The valid range usually runs from a liquidity sweep to the opposing extreme. If neither end took out liquidity, question whether it is the real range.
- Redraw only when structure breaks. A confirmed break of structure or shift in character creates a new dealing range. Until then, leave the zone fixed — constant redrawing is how bias flips candle to candle.
- Do not anchor to a wick you do not respect. If you use the body-defined swing for structure, stay consistent; mixing wick highs with body lows warps the 50% line.
Equilibrium is only meaningful relative to a range the market is actually trading inside. A perfect 50% line on a dead range tells you nothing.
One more discipline point: the zone is a filter, not a signal. Premium and discount tell you where you are allowed to look for a trade, not when to click. You still need an entry model — an order block, a fair value gap, an optimal trade entry — inside the correct half of the range.
Frequently Asked Questions
Is equilibrium always exactly 50%?
Yes. Equilibrium is the literal midpoint of the dealing range. The premium and discount labels describe which side of that 50% line price is trading on, so the level itself never shifts unless you redraw the range.
Do I buy in discount or wait for a signal there?
Discount is a filter, not a trigger. In a bullish bias you wait for price to reach discount, then look for an actual entry model — an order block or fair value gap — inside that zone before committing.
How often should I redraw my dealing range?
Only when structure changes. A confirmed break of structure or change of character on your working timeframe defines a new range. Redrawing on every pullback is the fastest way to lose your bias.
Related query paths
Once your zones are drawn, these are the natural next reads.
- PD Array ICT Explained: A Trader's Guide to Premium & Discount — see how PD arrays populate the two halves you just mapped.
- OTE Explained: The ICT Optimal Trade Entry Zone — the entry model you run inside the discount or premium zone.
- Consequent Encroachment: The 50% FVG Rule — the same equilibrium logic applied inside a fair value gap.
- What Is Market Structure in ICT? — how structure breaks define when to redraw the range.
- Liquidity Sweep Explained: The ICT Stop Hunt — how to confirm the leg that anchors a valid range.
- How to Draw a Dealing Range in ICT (Correctly)
- What Are the 4 Trading Zones? ICT Dealing Range