
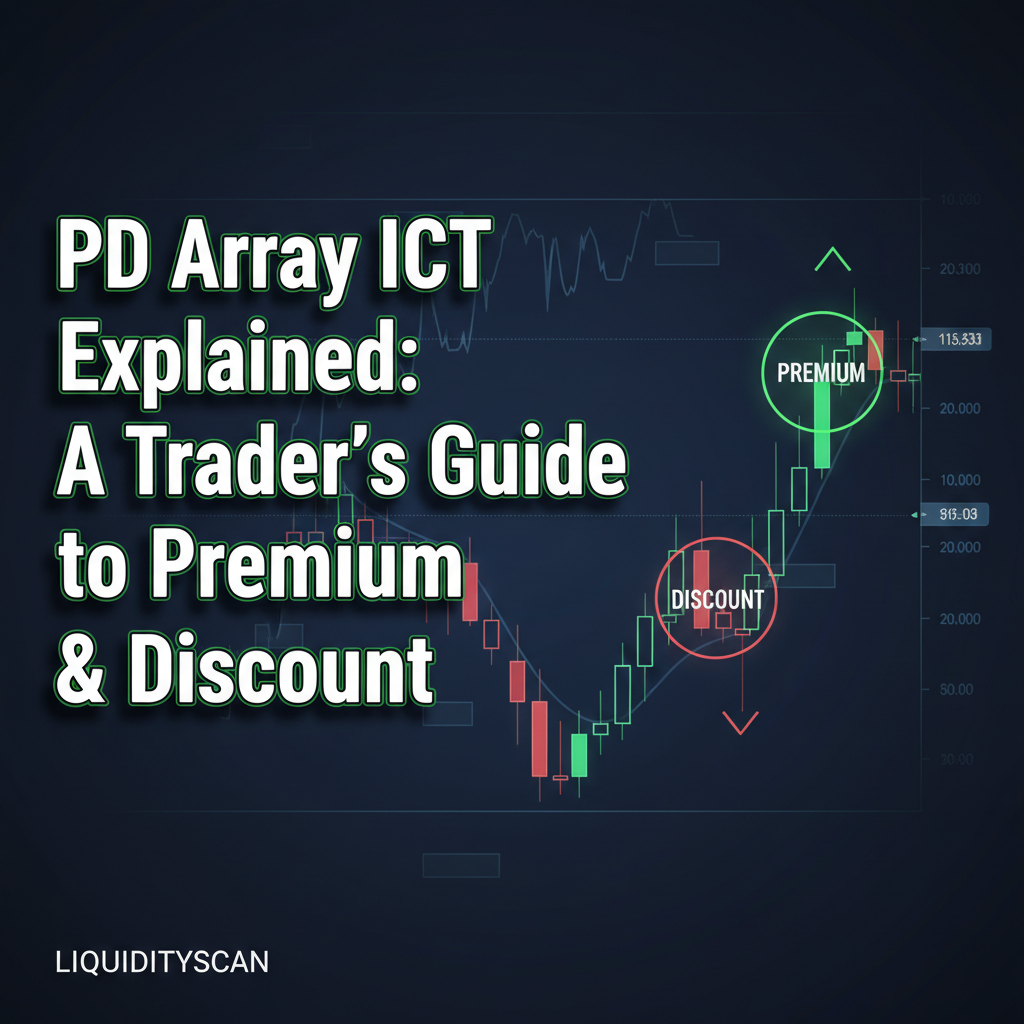
The ICT Premium/Discount (PD) Array isn't just a list of terms. It's a systematic framework for reading price delivery and identifying where institutional algorithms are likely to reprice.
Beyond the 50% Line: Defining Your Operational Range
Strip it down and the PD Array is really one thing: a way to read price inside a defined dealing range. Every meaningful leg, on the Daily or the 15-minute, lives between a swing high and a swing low. Cut that range in half and you get Equilibrium (EQ) at the 50% mark. That line isn't arbitrary. It marks balance, the point where buyers and sellers have agreed on value. As Investopedia puts it, equilibrium is the state where market supply and demand balance each other, and prices settle. For our purposes, EQ is the fulcrum the rest of the analysis pivots on.
Anything above Equilibrium sits in a Premium. Price up here is objectively expensive relative to the range you've drawn, so this is where you hunt for sell-side setups. Drop below EQ and you're in a Discount, where price is cheap and your attention belongs on buy-side opportunities.
That single division is the first filter every decision passes through. I've watched plenty of developing traders blow themselves up taking textbook-looking setups in the wrong half of the range. A clean bullish order block means almost nothing when it's buried deep in premium, because the algorithm has zero reason to buy expensive. Step one, every time, is anchoring your read to a clear range and its Equilibrium. If you're shaky on how that range gets framed in the first place, our breakdown of market structure in ICT covers the swing points you're keying off.
The Hierarchy of the PD Array: From Order Blocks to Voids
With your Premium and Discount zones marked, the PD Array hands you a catalog of specific institutional reference points. They're not all equal. There's a clear pecking order that tells you where price is most likely to react.
Think of it as a checklist the algorithm runs as it retraces through a price leg:
- Fair Value Gaps (FVGs) / Imbalances: These three-candle patterns represent a failure to offer one side of the market, creating an inefficiency. They are magnets for price. An FVG in a discount zone is a primary target for price to retrace to before continuing higher. If the mechanics feel fuzzy, our primer on what a fair value gap actually is walks through the candle structure.
- Order Blocks (OBs): The last opposing candle before a strong move that breaks market structure. A bullish OB in discount or a bearish OB in premium is a high-probability point of institutional interest. Price often returns to mitigate these blocks. We cover the full anatomy in our order block explainer.
- Breaker Blocks: When a swing high is run and then price aggressively breaks a prior swing low, the bullish order block that was formed just before the run on the high becomes a bearish Breaker Block. It's a failed OB that flips its function, now acting as potent resistance.
- Mitigation Blocks: Similar to a Breaker, but it forms when a swing high or low fails to take liquidity before a market structure shift. It’s a point where the market must return to “mitigate” the trapped positions. The two get confused constantly, so it's worth reading the one difference that separates a mitigation block from a breaker.
- Liquidity Voids: A large gap in price consisting of only candle bodies with no overlapping wicks. This signifies an extremely aggressive move. Price will often seek to return and fill this void, delivering price more efficiently on the way back.
- Rejection Blocks / Wicks: Long wicks represent a strong rejection of a price level. While less precise than an FVG or OB, the high or low of a significant wick can act as a reference point, especially on higher timeframes.
The order matters: scan for these elements after you've fixed your range and EQ, not before. You're not trawling for any old FVG. You want an FVG sitting in discount that backs your thesis for a move higher.
A Practical Example: Mapping the PD Array on EUR/USD
Let's make this tangible. Say EUR/USD has been trending down on the Daily. It prints a swing high at 1.0980, displaces lower, and carves out a swing low at 1.0600. Our dealing range is now 380 pips wide.
First job is finding Equilibrium. The 50% level lands at 1.0790. Everything above that is premium, so we're shorts-only up there. Everything below is discount.
Now we scan the leg down from 1.0980 for PD Array elements. We might find:
- A large bearish order block on the Daily chart from 1.0920 to 1.0940. This is a high-priority area of interest within the premium.
- A Fair Value Gap on the 4H chart between 1.0850 and 1.0870, also in the premium.
- A small, failed swing low around 1.0750 in the discount zone. Read it as inducement, a pool the market can sweep before a possible retracement higher. If that idea is new, our piece on what a liquidity sweep is spells out the trap.
With that map in front of you, the plan writes itself. Rather than shorting blindly into every rally, we sit on our hands until price draws up into premium. The FVG at 1.0850 is the first logical target. The more patient play is waiting for a test of the daily order block near 1.0920. Any long below 1.0790 is a low-probability counter-trend trade until a genuine market structure shift comes through. When you do find your entry inside discount, the optimal trade entry model is where the premium/discount logic gets surgical, and once you're in, our SMC stop loss and take profit framework shows how to place stops and targets against these same levels.
For my own trading, mapping this out is non-negotiable. It keeps me from getting caught on the wrong side of what the algorithm is trying to do. The LiquidityScan Core Layer tool can draw these ranges and key institutional levels for you, which saves real time when you're tracking more than one market at once.
Why the PD Array Matters: It’s a Map of Price Discovery
The PD Array is more than a bag of ICT patterns. It's a model for how price discovery actually works. As the CME Group explains, price discovery is the process by which a market finds a security's price through the interaction of buyers and sellers. The Interbank algorithm doesn't shuffle price around at random. It moves with purpose, and that purpose is to seek liquidity and rebalance inefficiencies.
When price walks away from an FVG in discount, that inefficiency is something the algorithm is mandated to eventually correct. When structure breaks, the order block that powered the move turns into a sponsored level where institutions may defend their positions. The PD Array gives you a logical map of these probable points of interest.
Frame everything inside a premium/discount context and your actions start lining up with the likely flow of institutional order flow. You stop chasing candles and start anticipating where price is being pulled. That switch from reactive to proactive is exactly what separates breakeven traders from consistent, professional ones.