
What Is the IPDA?
IPDA stands for Interbank Price Delivery Algorithm. In Inner Circle Trader (ICT) terminology, it names the idea that price is delivered algorithmically rather than drifting at random.
It is a mental model, not a documented piece of software you can inspect. ICT uses it to describe how price appears to reach for liquidity and then correct inefficiency in a repeatable way.
The value of the concept is behavioral. Whether or not a single literal algorithm exists, framing the market this way helps you anticipate where price is likely headed next.
Think of IPDA as a scheduler. It has a to-do list of liquidity pools to touch and imbalances to fill, and it works through that list across time.
How the Algorithm Delivers Price
Under the IPDA lens, price does two jobs. First, it seeks liquidity, the resting orders sitting above old highs and below old lows. Second, it rebalances inefficiency, revisiting price gaps where trade was one-sided.
This is not a mystical force. It mirrors how institutional order flow actually behaves: large participants need counterparties, and the deepest counterparties cluster around obvious stop levels.
So a run above a prior high is not "manipulation" for its own sake. It is the delivery engine sourcing the liquidity it needs to fill size, then continuing toward its next objective.
Rebalancing is the other half. When price moves too fast in one direction, it often returns to trade through the skipped area before advancing again, restoring two-sided fairness.
I find it cleaner to describe IPDA as behavior than as belief. You do not need to know its inner workings to notice that liquidity and inefficiency repeatedly explain the path price takes.
IPDA Data Ranges: The 20/40/60-Day Lookback
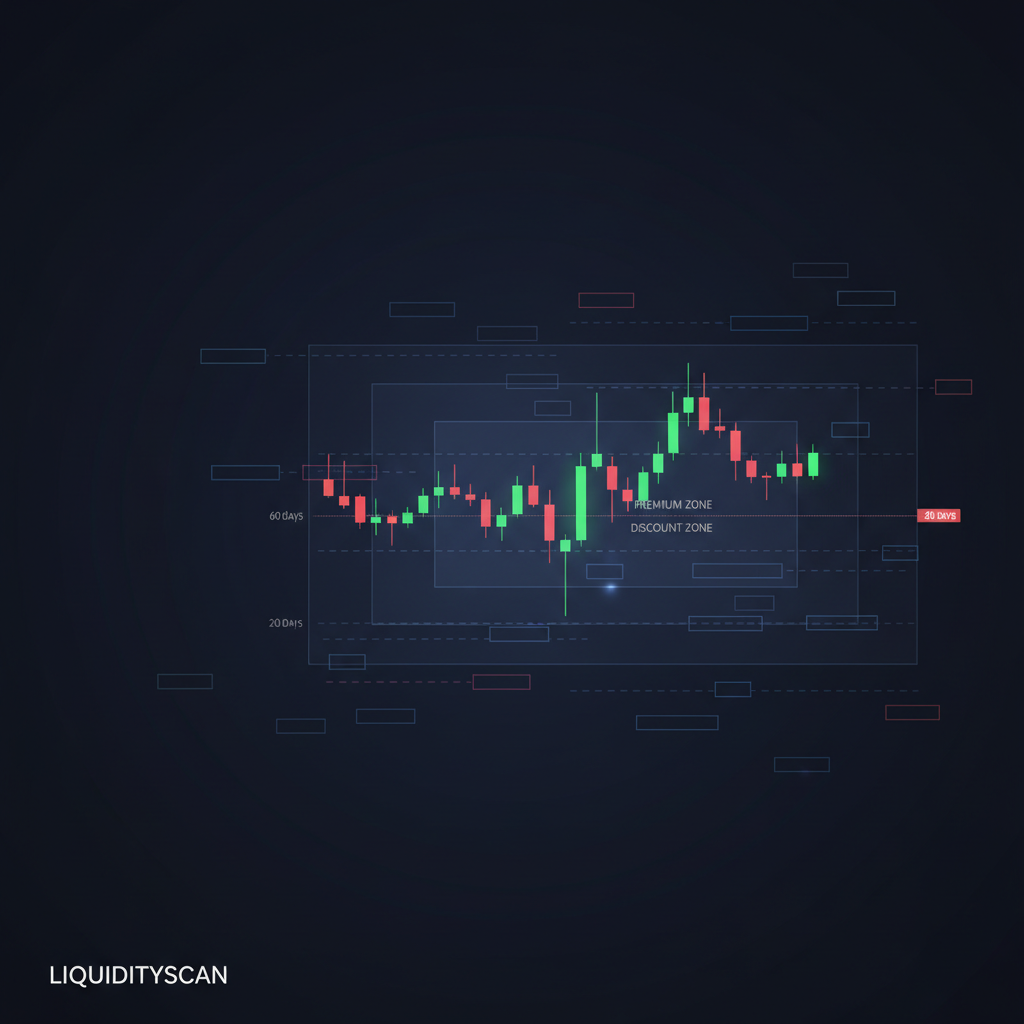
ICT frames IPDA around three rolling lookback windows: the last 20, 40, and 60 trading days. These are the data ranges the algorithm is said to reference.
The practical use is simple. Mark the highest high and lowest low across each range, and you get a dealing range that defines where meaningful liquidity and unfilled inefficiency live.
The 20-day range captures recent, actionable structure. The 40 and 60-day ranges add context, showing whether the current move sits inside a much larger unresolved swing.
These windows matter because they keep your analysis honest. Instead of drawing levels from arbitrary points, you anchor them to a consistent, backtestable lookback that many algorithmic trading systems also key on around monthly horizons.
When old highs and lows from these ranges are swept and then price reverses, that is the delivery engine collecting liquidity at a level you could have marked in advance.
IPDA, Premium and Discount
Once you have a dealing range, you split it at the 50% midpoint into a premium half and a discount half. IPDA is thought to deliver toward premium to sell and toward discount to buy.
Premium and discount, and the PD array framework that populates a range with fair value gaps, order blocks and liquidity pools, are the toolkit IPDA delivers to. I lean on those arrays rather than re-explaining them here.
The pairing is the point. Data ranges tell you where the dealing range is; premium and discount tell you which half of it currently favors buyers or sellers.
In my own routine, I will not take a long from deep premium or a short from deep discount, because that fights the direction the delivery model is most likely to push.
Practical Takeaways
Do not treat IPDA as a signal. Treat it as a bias framework that sits on top of the reads you already trust.
Start by marking the 20/40/60-day highs and lows. Then split the relevant range into premium and discount. That alone gives you a directional lean and a set of levels worth watching.
Next, confirm with market structure. A liquidity sweep that aligns with a structure shift is far stronger than either read alone, so use them together rather than in isolation.
Keep expectations honest. IPDA does not predict every candle; it improves the odds that you are trading with the flow rather than into it. This is where a tool like LiquidityScan helps by surfacing sweeps and structure so you spend less time hand-marking.
The trap to avoid is turning a mental model into dogma. Let the ranges, liquidity and inefficiency guide bias, and let your actual entry rules and risk management do the deciding.
Frequently Asked Questions
Is the IPDA a real algorithm you can see?
No. IPDA is ICT's conceptual model for how price seems to be delivered. You cannot inspect it directly, but you can observe the liquidity-seeking and rebalancing behavior it describes and use that behavior to build bias.
Why 20, 40 and 60 days specifically?
These rolling windows give short, medium and longer context roughly around a monthly horizon. Marking each range's high and low produces consistent, backtestable dealing ranges instead of arbitrary levels drawn from random swings.
How is IPDA different from premium and discount?
IPDA is the delivery concept; premium and discount describe where inside a dealing range price currently sits. IPDA delivers price toward one half or the other, and the PD array tools tell you what to expect at each level.
Related query paths
Build the full picture by pairing IPDA with the concepts it depends on.
- The Definitive Guide to ICT Trading — the methodology IPDA belongs to.
- PD Array Explained: Premium and Discount — the arrays IPDA delivers price to.
- What Is Market Structure in ICT — how to confirm the delivery you're anticipating.