
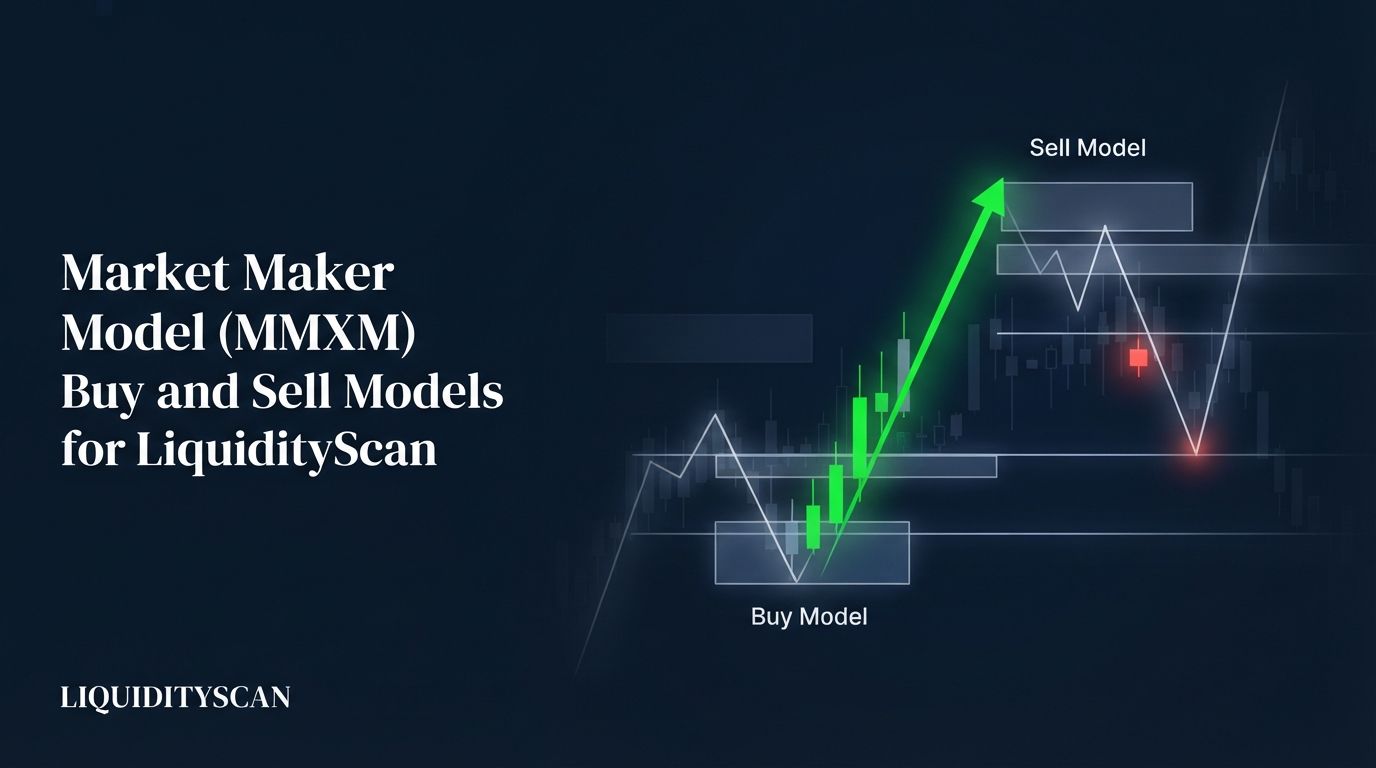
What Is the Market Maker Model (MMXM) in ICT?
The market maker model (MMXM) is ICT's framework for one complete delivery cycle: price engineers a move away from a consolidation while smart money accumulates against that move, reverses at a higher-timeframe array, then re-delivers through the same zones back toward the origin.
The model has two variants. The Market Maker Buy Model (MMBM) opens with an engineered decline that builds long positions and resolves higher. The Market Maker Sell Model (MMSM) opens with an engineered rally that builds short positions and resolves lower. Both share one anatomy: original consolidation, first curve, reversal, mirrored second curve, distribution back at the origin.
"Market maker" is shorthand, not a literal villain. FX runs on dealer intermediation — the BIS Triennial Survey measured turnover above $7.5 trillion per day, most of it passing through desks and algorithms that must offset inventory against resting orders. The MMXM describes what that inventory cycle looks like on a chart, not a scripted conspiracy.
Treat the MMXM as the container and other ICT tools as its contents. Power of 3 (PO3) compresses the same accumulation–manipulation–distribution logic into a single session; the MMXM stretches it across a full range-to-range cycle, with the Order Block, Fair Value Gap (FVG), and Liquidity Sweep marking its turning points.
The Market Maker Buy Model (MMBM), Leg by Leg
An MMBM reads left to right as a lopsided V anchored to a consolidation. The left side is the engineered decline; the right side is the true move. Five stages, always in this order.
Stage 1: The Original Consolidation
Every valid MMBM begins in a sideways range where price sits near equilibrium and both sides build positions. This origin matters more than any other level, because it defines the model's final objective: the cycle is not complete until price trades back into it. Mark its high, low, and midpoint before anything else.
Stage 2: The Sell-Side Delivery Curve
Price breaks below the range and delivers lower in steps, not a straight line. Typically you get two or three drops, each punctuated by a smaller consolidation. ICT frames each pause as an accumulation stage — smart money buying into declining prices, absorbing the panic selling each new low generates.
The mechanism is stop-driven. Each break of a prior low fires clustered sell stops — Sell-Side Liquidity (SSL) — and those market sells are exactly the counterparty a large buyer needs. The deeper the curve runs, the more size gets filled at progressively better prices. Log the level of every intermediate consolidation; they become targets on the way back.
Stage 3: The Smart Money Reversal at the Terminus
The decline ends at the terminus: a sweep of an obvious old low that lands inside a higher-timeframe discount array — a weekly Fair Value Gap, a daily Order Block, or a major old low's liquidity pool. The reversal signature is concrete: sweep first, then Displacement upward, then a Market Structure Shift (MSS) above the most recent lower high.
Without that three-part sequence, a new low is just trend continuation. The smart money reversal is also the one point in the model where risk defines itself tightly — the stop belongs below the sweep wick and nowhere else.
Stage 4: The Buy-Side Delivery Curve
Price now re-delivers upward through the same steps it carved on the way down, in reverse order. Each consolidation from the sell-side curve gets revisited, and each visit should produce a reaction: either a pause followed by continuation through it, or a pullback into it that offers a re-entry with the next zone as the target.
Stage 5: Distribution at the Original Consolidation
The cycle completes when price returns to the origin range. Here the accumulated longs get distributed — handed to breakout buyers chasing a move that is already finished. For a trader this is a take-profit zone, not a fresh-long zone. Above the origin, the model has no further opinion.
The Market Maker Sell Model (MMSM): The Mirror Image
The MMSM inverts every element. Price leaves the original consolidation upward, rallies in two or three steps while smart money distributes shorts into strength, sweeps Buy-Side Liquidity (BSL) above an obvious high into a premium array, reverses with displacement down, then re-delivers through the same zones toward the origin. One table covers the mapping.
| Element | Market Maker Buy Model (MMBM) | Market Maker Sell Model (MMSM) |
|---|---|---|
| First curve | Sell-side delivery: engineered decline | Buy-side delivery: engineered rally |
| Smart money activity | Accumulating longs into falling prices | Building shorts into rising prices |
| Terminus | SSL sweep into an HTF discount array | BSL sweep into an HTF premium array |
| Reversal signature | Sweep, displacement up, bullish MSS | Sweep, displacement down, bearish MSS |
| Second curve | Re-delivery up through the old zones | Re-delivery down through the old zones |
| Completion | Origin consolidation: longs distributed | Origin consolidation: shorts covered |
Directional context decides which model to look for. If the higher-timeframe Draw on Liquidity is above and price is dropping out of a range into discount, hunt an MMBM terminus. If the weekly chart wants lower prices and a range breaks upward into premium, the rally is the suspect leg of an MMSM.
Curve Symmetry: Price Re-Delivers Through the Same Zones
The defining insight of the MMXM is symmetry. Zones from the first curve get reused on the second, with roles flipped: in a buy model, each accumulation consolidation from the decline becomes a re-delivery zone on the rally — where part of the accumulated position gets paired off against fresh momentum buying, so price pauses or retraces exactly there.
The mechanism is unfinished business. Each step down leaves an inefficiency — usually an FVG — plus trapped sellers whose breakeven sits at the old consolidation. When price returns, algorithms re-price through the gap and trapped shorts cover, producing the reaction. A consolidation printed at 1.0810 on the way down should matter again at 1.0810 on the way up.
Symmetry has three practical uses. It pre-builds the target ladder: every old consolidation is one objective, in order. It staggers exits: scale at each re-delivery zone rather than guessing one terminal print. And it grades the move: slicing through a zone without pause is displacement in your favor, while a hard rejection before reclaiming the first zone questions the entire read.
How to Identify Which Stage of the Market Maker Model You're In
Stage identification is a checklist, run top-down, not an impression:
- Find the origin. Scan left on the 4H or daily for the consolidation the current move launched from. No clear origin range means no model — stop here.
- Count the steps. Two or three completed drop-and-pause sequences mean the curve is mature and a terminus is plausible. One step means you are early and should assume continuation.
- Locate the HTF array. For a buy model, is there a weekly or daily discount array below the current low? A terminus with no array beneath it is a guess.
- Check the liquidity. Has an obvious pool — equal lows, prior week's low — actually been swept? Before the sweep, the first curve is still running.
- Demand the shift. Only displacement plus an MSS flips the model from forming to reversed. Until then you are on the left curve, positioned against the side doing the accumulating.
Position inside the Dealing Range is the cross-check. The left curve of an MMBM travels from equilibrium into deep discount; the right curve travels from discount back through equilibrium toward premium. If your stage count says "reversal done" while price sits at equilibrium with no sweep behind it, the count is wrong.
Trading the Model: Reversal and Re-Delivery Entries
The Reversal Entry at the Terminus
The highest-conviction MMXM trade is the reversal after the terminus sweep. Requirements: price trades into a pre-marked HTF discount array, sweeps a defined sell-side pool, displaces upward leaving an FVG, and shifts structure. Enter on the retrace into that FVG or the Optimal Trade Entry (OTE) zone of the displacement leg; stop below the sweep low.
The geometry is what makes it worth waiting for. Because the target ladder was built by the first curve, the first re-delivery zone alone usually sits a multiple of the stop distance away — the reward side is pre-measured before entry.
Continuation Entries at Re-Delivery Zones
Missing the terminus does not kill the trade. Each pullback into a reclaimed zone — an old accumulation consolidation, a breaker, the impulse-leg FVG — is a continuation entry targeting the next zone. Demand a lower-timeframe reaction rather than resting blind limit orders; a zone that fails silently is the model telling you it is done.
Where the ICT Market Maker Model Meets the PD Array Matrix
The terminus is never a random low; it should be the first meaningful HTF discount array beneath the swept pool — an old weekly FVG, a daily order block, or the Consequent Encroachment of a large gap.
Anchoring the MMXM to a drawn dealing range and Premium and Discount zones is what separates a model read from curve-fitting: the reversal must occur where a higher-timeframe framework already expected buyers. SMT Divergence against a correlated pair at the terminus is a strong bonus filter.
LiquidityScan's sweep and order-block scanners flag exactly this event class — HTF liquidity taken into a discount array with displacement — in real time, which shortens the stage-counting work considerably.
Common Misreadings and the Hindsight Problem
The most common error is calling every V-shaped reversal an MMXM. The model requires a consolidation origin. A V-bottom printed mid-trend, with no origin range above it and no stepped accumulation curve behind it, is just a reversal — the symmetry logic has nothing to anchor to and the "targets" are inventions.
Other recurring misreads:
- Counting stages after the fact. Three accumulation stages are obvious in hindsight; live, every pause looks like a possible terminus. Fix: the HTF array plus the sweep decide the terminus, never the stage count alone.
- Treating the curve as a schedule. Some cycles complete in two steps, some in four. Symmetric reactions at old zones matter more than hitting a textbook count.
- Trading the left curve. Buying "accumulation stage two" of an MMBM is catching a falling knife with a narrative attached. The model becomes tradeable at the confirmed reversal, not before.
- Ignoring invalidation. A close back below the terminus low after the MSS kills the model. The "it will sweep twice" story is usually an average-down in costume.
Be honest about what the MMXM is: descriptive scaffolding. Drawn after completion, almost any range-to-range cycle fits it, which makes the full model nearly untestable as a single unit. What is testable is the terminus mechanic — sweep plus displacement plus shift inside an HTF array.
Published sweep-reversal results vary too widely by market, timeframe, and filter for one honest win rate to be quoted; run the terminus criteria over your own instrument and journal at least 50 instances before sizing it. The model earns its keep as context and target structure, tradeable only with strict reversal confirmation.
Worked Example: A Full MMBM Cycle on EURUSD
Setup on the 4H chart: EURUSD consolidates for six sessions between 1.0850 and 1.0880 — the origin, midpoint 1.0865. Below, a weekly FVG sits at 1.0735–1.0755, and last month's equal lows rest at 1.0750. Both are marked before anything breaks.
Sell-side curve: price loses 1.0850 and drops to 1.0810, then consolidates for two sessions — accumulation stage one. A second leg reaches 1.0770 and pauses — stage two. The final leg runs 1.0750, printing 1.0742 inside the weekly FVG: the terminus sweep, taking the equal lows' sell-side liquidity directly into the discount array.
Reversal: within three 4H candles price displaces to 1.0781, leaving a 1H FVG at 1.0757–1.0765 and closing above the 1.0770 swing — MSS confirmed. Entry 1.0763 inside the FVG/OTE confluence; stop 1.0738, four pips under the sweep low. Risk: 25 pips.
Buy-side curve: price re-delivers to 1.0810 — the first re-delivery zone, +47 pips, roughly 1.9R — pauses two sessions, dips 15 pips, then continues. Next objective 1.0850, the origin low: +87 pips, about 3.5R. Final scale-out into distribution at the 1.0865 midpoint, +102 pips, roughly 4R on the initial risk.
Notice what made this tradeable live rather than in hindsight: the origin was marked before the breakdown, the weekly FVG before the terminus, and no long existed until sweep, displacement, and MSS had all printed. Remove any one of those and the same chart is a guess.
That discipline is the entire value of the market maker model in ICT. It does not predict the low — it tells you where a low would make sense, what confirmation to demand when price gets there, and exactly which zones price should re-deliver through if the read is right.
Frequently Asked Questions
Is the market maker model the same as ICT Power of 3?
They share the accumulation–manipulation–distribution logic but operate at different scales. PO3 typically frames one session or day around its opening price; the MMXM frames a complete range-to-range cycle spanning days or weeks. In practice a PO3 manipulation leg often forms the terminus sweep nested inside a larger MMXM.
What timeframe is best for spotting an MMXM?
Map the model on the 4H or daily chart, where the origin consolidation and stepped curves stay distinct, then drop to 15-minute or 1H for the reversal confirmation and entry. On very low timeframes the pattern technically appears everywhere, but sweeps are constant and stage-counting becomes noise rather than structure.
Do market makers really push price down just to buy?
No desk needs to push anything; large buyers simply need sellers. Stops resting below obvious lows are the densest source of forced selling available, so price gravitating there before reversing reflects liquidity-seeking execution by dealers and algorithms. The MMXM describes that footprint — engineered-looking, but mechanical rather than personal.
How many accumulation stages should a valid MMBM have?
Two or three is typical, but the count is descriptive, not a rule. Validity comes from the origin consolidation, a stepped rather than straight-line decline, and a terminus at swept liquidity inside a higher-timeframe discount array. Forcing a fixed stage count onto every chart produces patterns that were never there.
Related query paths
Work through these in order to build the full context around the MMXM — structure vocabulary, liquidity mapping, range anchoring, and the session-scale version of the same cycle.
- What Is Market Structure in ICT? — the shift and break vocabulary the reversal confirmation depends on.
- BSL vs SSL in SMC: Identify Liquidity — how to mark the pools each delivery curve is actually targeting.
- Liquidity Sweep Explained: The ICT Stop Hunt — the terminus event in isolation, with its confirmation criteria.
- How to Draw a Dealing Range in ICT (Correctly) — anchoring equilibrium so left curve and right curve have context.
- PD Array ICT Explained: A Trader's Guide to Premium & Discount — the array matrix that defines where a curve should terminate.
- ICT Power of 3 (PO3): The AMD Cycle Explained — the session-scale AMD cycle that nests inside the MMXM.
- Liquidity in ICT: Why Price Moves to Buy-Side and Sell-Side Pools — how it connects to liquidity in ict.