
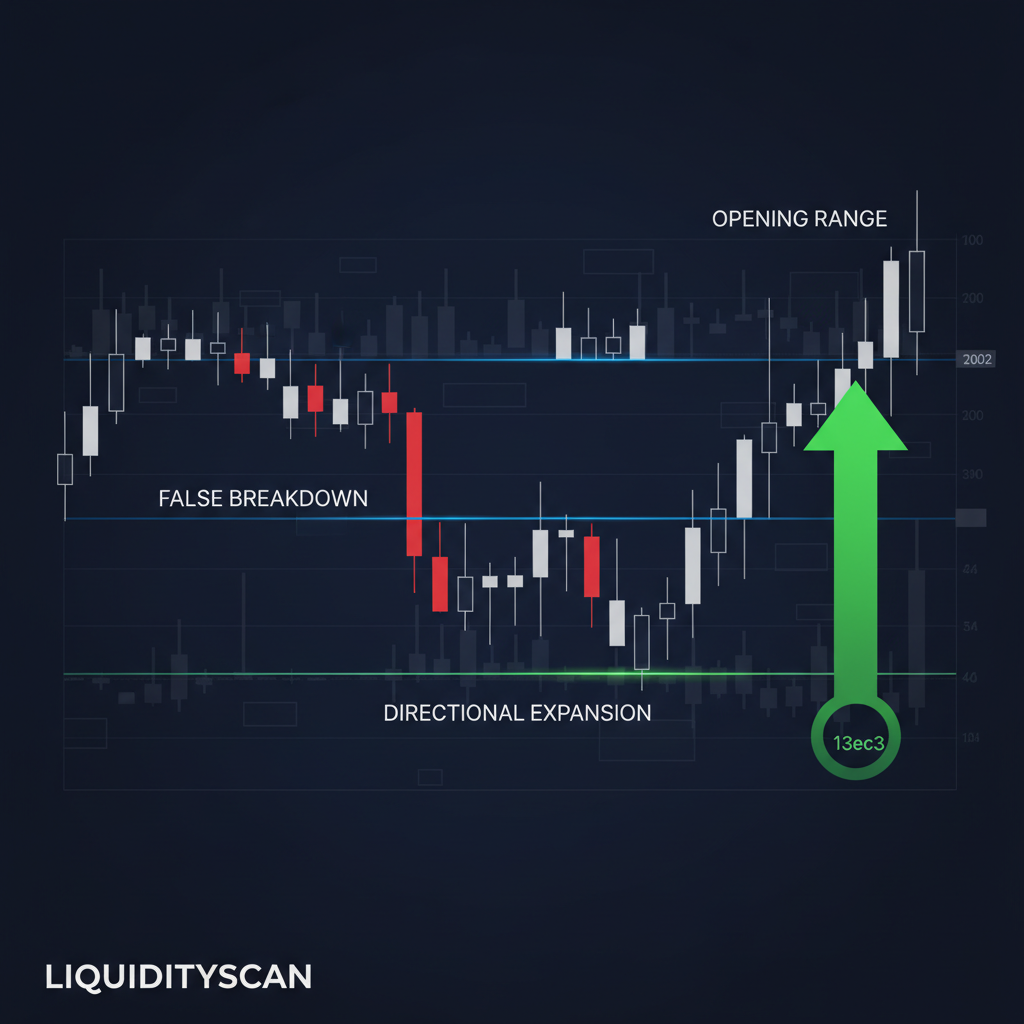
What Is the Power of 3 (PO3)?
Power of 3, or PO3, is an ICT model that says every completed candle is built from three phases: accumulation, manipulation and distribution. Together they spell AMD, the engine behind most intraday and daily moves.
The idea borrows from classic Wyckoff accumulation and distribution logic, where large participants build a position before an expansion. You can see the accumulation and distribution concept described in traditional terms too.
PO3 simply frames that cycle inside a single candle's life. The open is where position-building begins, the wick is where retail gets trapped, and the body is where price finally delivers toward its true objective.
What makes the model useful is that it reframes noise as intent. Instead of asking whether a candle is bullish or bearish, you ask which phase you are in and which liquidity has not yet been taken. That question keeps you from chasing the very move designed to catch you.
The Three Phases
Each phase has a job. Read them in order and a messy chart starts to look intentional. Below I break down what accumulation, manipulation and distribution actually do to price.
Accumulation
Accumulation is the quiet, range-bound opening. Price coils near the daily or session open while smart money quietly builds a position without tipping direction.
This phase looks boring on purpose. Tight ranges and false calm let institutions load orders against the liquidity resting on both sides of the range.
Manipulation (Judas Swing)
Manipulation is the trap. Price makes a sharp move against the intended direction — the Judas swing — to run stops and pull breakout traders into the wrong side.
This is a deliberate liquidity sweep: a spike beyond an obvious high or low that taps resting orders, then reverses. If you entered on that break, you become the fuel for the real leg.
The manipulation phase is the single most misread part of PO3, and it is why patience beats prediction here.
Distribution
Distribution is delivery. After the sweep, price expands hard in the true direction, often with displacement — a strong, wide-range move that leaves a fair value gap behind.
This is where the candle body forms and where trend-following entries finally pay. Distribution is what most people wrongly call "the trend," missing that it started with a trap.
The tell is momentum. Accumulation and manipulation are slow and choppy; distribution is fast and decisive. When you feel price suddenly move with conviction after a sweep, you are likely watching the delivery phase begin.
How the Daily Candle Reveals PO3
The daily candle is the cleanest PO3 lesson. The daily open marks where accumulation begins for that session's cycle.
From the open, price typically drifts one way to grab liquidity — that wick is your manipulation. Then it reverses and closes strongly the other way, painting a candle whose body points to the true direction.
Overlay session opens, and the fractal repeats. A bullish daily often dips below its open first (Judas), sweeps sell-side liquidity, then distributes upward into the close.
At LiquidityScan I watch where that opening drift stalls, because a failed sweep frequently marks the exact pivot for the distribution leg.
Trading a PO3 Setup Step by Step
Here is the sequence I follow so I stop entering on the manipulation and start entering on the distribution.
First, mark your reference: the daily open or session open, plus the obvious liquidity pools resting above the highs and below the lows.
Second, wait through accumulation. Do not trade the range; let price build and identify which side of liquidity looks most vulnerable.
Third, watch for the manipulation sweep — a spike that takes those stops and immediately rejects. That rejection is your signal that the trap is set.
Fourth, confirm a market structure shift in the opposite direction. Displacement through a recent swing point tells you distribution has begun.
Fifth, enter on the retrace into the imbalance left by that displacement, place your stop beyond the manipulation extreme, and target the opposite liquidity pool. Risk sits behind the trap, not inside the move.
PO3 Across Timeframes (Weekly, Daily, Session Fractal)
PO3 is fractal. The weekly candle accumulates early in the week, often manipulates around Monday or Tuesday, then distributes into Thursday and Friday.
Nest the daily inside the weekly, and the session inside the daily. A London Judas swing can be the manipulation phase for the whole daily candle's distribution.
Aligning these layers is where PO3 gets powerful: when the session sweep agrees with the daily direction and the weekly bias, you are trading with the flow instead of against the trap. The CME's index products, described by the CME Group, show the same session-driven rhythm across futures.
Frequently Asked Questions
Is the Power of 3 the same as AMD?
Yes. PO3 and AMD describe the identical three-phase cycle — accumulation, manipulation, distribution. AMD names the phases; PO3 names the model that frames them inside a candle.
What is the Judas swing in PO3?
The Judas swing is the manipulation phase — a deliberate false move that sweeps liquidity and traps traders before price reverses into the real distribution leg.
Which timeframe is best for trading PO3?
The daily candle teaches the cleanest lesson, but PO3 is fractal. Many traders read the daily for bias and execute PO3 on session opens like London and New York.
Related query paths
Build your PO3 read on these foundations and adjacent concepts.
- Market structure in ICT — read structure first so you can spot the shift that confirms distribution.
- Liquidity sweep and the ICT stop hunt — the manipulation phase in detail.
- ICT kill zones guide — when the phases actually fire during the session.
- The definitive ICT trading guide — the full methodology behind PO3.