
What Is Liquidity in ICT?
Liquidity in ICT is the pool of resting orders — protective stop losses and pending buy or sell stops — clustered at obvious price levels. It is not volume. Price is drawn to these pools because institutions need resting orders as counterparties to fill large positions.
Every stop loss is a market order waiting for a trigger. A trader who buys EURUSD at 1.0820 and places a stop at 1.0798 has parked a guaranteed market sell at 1.0798. A breakout trader with a buy stop above a swing high has parked a guaranteed market buy.
Multiply that by thousands of accounts anchoring risk to the same obvious level and you get a liquidity pool: a dense cluster of forced future transactions.
This is why the ICT definition deliberately excludes volume. Volume measures orders that have already transacted — a record of the past. Liquidity in the ICT sense measures orders that have not yet transacted — fuel waiting to burn. A high-volume node tells you where business was done; a liquidity pool tells you where business must be done the moment price touches it.
Two behaviors follow directly from this definition. First, obvious levels attract price rather than repel it, which inverts the retail support-and-resistance model. Second, the strength of a level as a magnet is proportional to how many stops it shelters — which is exactly why clean, widely watched levels fail so reliably as protection.
Buy-Side and Sell-Side Liquidity: Where the Pools Form
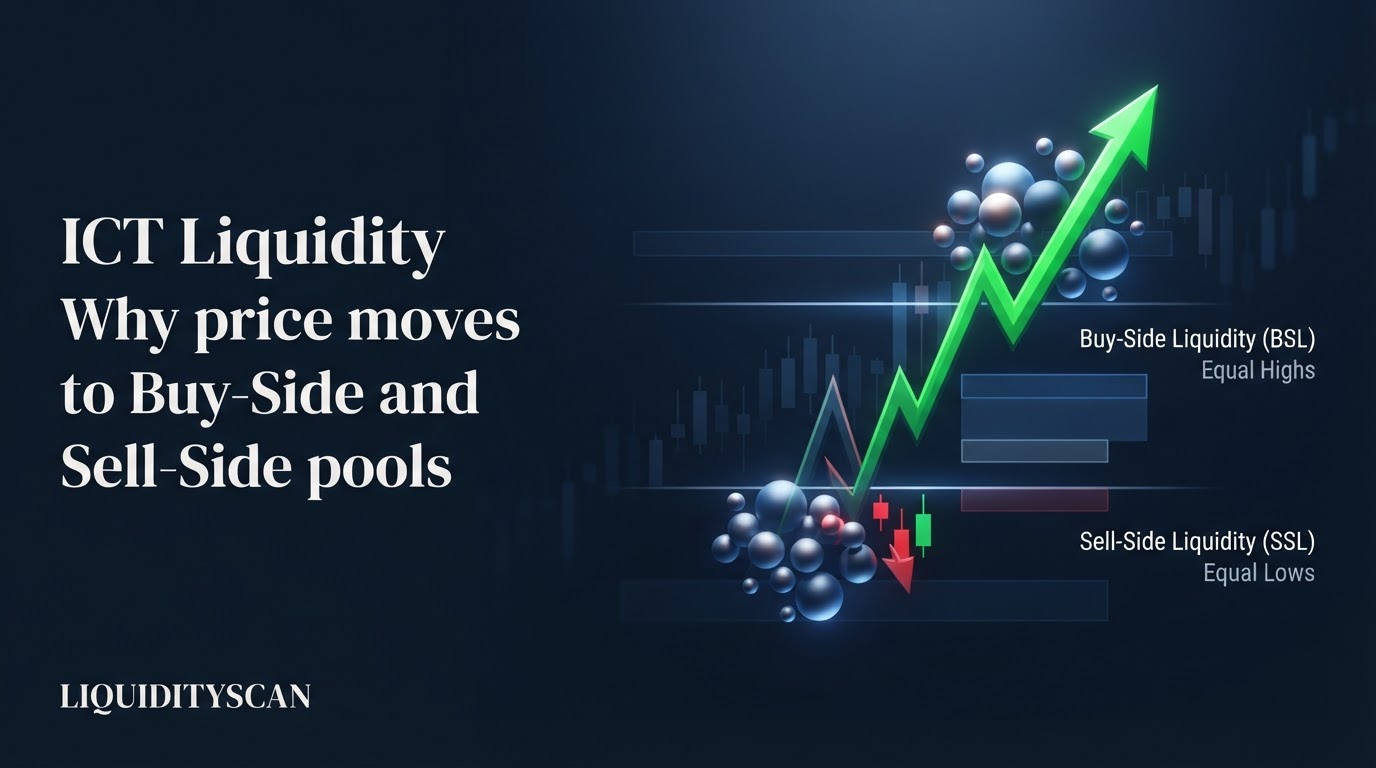
Buy-side liquidity (BSL) is the pool of buy stops resting above current price: stop losses protecting short positions plus pending breakout buy orders. Sell-side liquidity (SSL) is the mirror below price: stops protecting longs plus breakout sell orders. Price runs up to consume buy-side and down to consume sell-side — the names describe what gets taken, not who benefits.
Pools form wherever a large population of traders anchors risk to the same reference point:
- Equal highs and equal lows (EQH/EQL) — two or more touches within a few ticks; the most concentrated pools on any chart.
- Prominent swing highs and lows — any clean fractal extreme visible without squinting.
- Trendline liquidity — stops trailed along a rising or falling diagonal, harvested in one pass when the trendline "breaks."
- Session highs and lows — the Asian range, the London high and low, and New York session extremes reset the intraday pool map every day.
- Previous day, week, and month highs/lows — timeframe-anchored references that nearly every participant marks.
Obviousness scales the pool. Relative equal highs are a stronger draw than a single clean high because the second touch convinces more traders that the level "holds," inviting more shorts with stops just above it. Age matters too: an untapped weekly high that has survived for months shelters far more resting orders than a swing low from yesterday afternoon.
Why Price Moves Toward Liquidity: The Counterparty Problem
Markets are double auctions — every buy requires an equal sell. A 0.5-lot retail order fills instantly against the visible book. Institutional size does not. The BIS Triennial Survey puts global FX turnover around $7.5 trillion per day, yet the depth available at the top of the book at any single instant is a sliver of what a fund needs for one position.
Walk the mechanics. A fund wants a large ES long. If it simply lifts offers, its own buying pushes price up and it fills the tail of the position at progressively worse prices.
The efficient alternative is to accumulate where sell orders are forced into the market. Below equal lows sit thousands of sell stops; if price is pressed through those lows, every triggered stop becomes a market sell — exactly the counterparty flow the fund needs to fill its buying without chasing.
That is the core answer to why price moves to liquidity pools: large participants can only fill against resting orders, and resting orders cluster at obvious levels. The push into the pool is not noise around "support" — it is the fill event itself.
ICT formalizes this as the Interbank Price Delivery Algorithm (IPDA): price is delivered from liquidity to inefficiency and back, seeking resting orders on one side and rebalancing imbalances such as the Fair Value Gap (FVG) on the other. Whether you accept the algorithm framing or model it as plain auction mechanics, the observable behavior is identical and testable: price gravitates to stop clusters, transacts there, and frequently reverses.
Engineered Liquidity and Inducement
Pools do not only form organically — they are built. Engineered liquidity is the deliberate construction of an obvious level: price carves two clean equal highs, teaching traders that the level is resistance. Shorts accumulate against it with stops just above; breakout traders queue buy stops at the same spot. The market has manufactured its own future fuel, and the eventual run through the level is the harvest.
Inducement is the small-scale version: a minor pool placed between current price and the real point of interest. A typical sequence — price rallies, leaves a shallow pullback low just above a 4H Order Block, then dips.
Early buyers defend that pullback low, so their stops sit under it. Price takes those stops first, taps the Order Block beneath, and only then delivers the real move. The inducement pool bait-fills impatient entries so the genuine level can be reached with counterparty flow still available.
The session-scale expression is the Judas Swing: a false directional move at a session open, engineered to run one side of the overnight range and trap breakout traders before the true daily expansion goes the other way. The Turtle Soup setup is simply the trade that fades this failed breakout back into the range.
Draw on Liquidity: The Daily Magnet
The Draw on Liquidity (DOL) is the specific pool price is most likely reaching for next — the magnet that frames directional bias. Instead of asking "is the trend up or down," an ICT trader asks "which pool is unfinished business?" If the sell-side under the previous day's low has been taken and price has displaced higher, the open draw flips to buy-side at the week's high.
Candidates for the daily draw, in rough order of gravity: the untapped previous day high or low, the current week's high or low, the external extremes of the active dealing range, and old unmitigated highs or lows on the daily chart. Location refines the pick: when price trades in the discount half of its dealing range, the higher-probability draw is buy-side above; in premium, sell-side below.
The DOL also organizes the daily candle's internal script. ICT's Power of 3 (AMD) describes the common sequence: accumulation around the open, a manipulation leg against the true direction — the Judas Swing, often consuming a minor pool — then distribution, the expansion toward the actual draw.
Once the draw is taken, the question resets: acceptance beyond it targets the next pool, while sharp rejection signals a sweep and a potential rotation toward the opposite side's liquidity.
How Liquidity Sweeps Work — and What Happens After
A liquidity sweep is the harvesting event: price spikes through a pool, triggers the resting stops, and — if the level was targeted rather than genuinely broken — rejects immediately. The tell is in the close. A sweep wicks beyond the level but closes back inside the prior range, because the triggered stops were absorbed by opposing institutional orders instead of igniting continuation.
Separating a sweep from a real breakout comes down to three observable facts:
- Close location — sweeps close back inside the range; breakouts close and hold beyond the level.
- Displacement — after a sweep, price leaves the level with energy, often printing a fresh Fair Value Gap in the new direction.
- Follow-through failure — a breakout that cannot make a new extreme within a few candles was probably a harvest.
Worked example, BTCUSDT 15-minute. Two session highs print at 118,400 and 118,420 — relative equal highs, buy stops stacked above. At the New York open, price runs to 118,650, stalls, and the candle closes back at 118,290. The next candle displaces down through the prior short-term low at 117,950, leaving a gap between 118,050 and 118,180.
The playbook: short the retrace into that gap, stop above the 118,650 sweep high, first target the sell-side pool at the prior day's low near 116,900. That geometry pays roughly 2R from the gap's lower edge and closer to 2.5R on a mid-gap fill — worth taking either way.
Confirmation matters. A sweep only becomes a trade after structure shifts against the swept direction — a Change of Character (CHoCH), a Market Structure Shift (MSS), or a CISD (Change in the State of Delivery). A spike through a level with no displacement afterward is not a signal; it may simply be the first leg of a genuine breakout that will retest and continue.
Liquidity in ICT Across Timeframes: Building the Map Top-Down
Pools are fractal — every timeframe prints equal highs and swing lows — but they are not equal. Higher-timeframe liquidity dominates: a weekly high shelters orders from swing traders, funds, and every intraday participant watching it, while a 5-minute equal high shelters an hour's worth of scalper stops.
When two pools conflict, price resolves toward the higher-timeframe one. Intraday levels are best read as stepping stones along the route to the HTF destination.
Step 1: Mark the external pools (monthly and weekly)
Chart the last 6–12 months. Mark untapped old highs and lows, weekly equal extremes, and the boundaries of the current dealing range. These are destinations, not entries.
Step 2: Set the daily frame
Mark the previous day's high and low, the weekly open, and any unmitigated daily swings sitting between price and the HTF pools. Decide the day's most probable draw on liquidity — and write down what price action would invalidate that read.
Step 3: Add session levels
Each day, mark the Asian range high and low and, as they form, the London high and low. These pools fuel the kill zone manipulations — the London or New York run that sweeps a session extreme before the real expansion begins.
Step 4: Maintain the map
Strike through each pool as it is taken and rank what remains by timeframe, obviousness, and age. A map full of spent levels is worse than no map. LiquidityScan automates this bookkeeping — its scanners track buy-side and sell-side pools across timeframes and flag sweeps in real time — but the discipline works identically by hand.
Everything else in the methodology hangs off this map. Order Blocks and Fair Value Gaps are where you enter; market structure tells you when; but liquidity in ICT is the why — the reason price leaves one level and travels to the next. Master the pools first, and every other tool inherits its context.
Frequently Asked Questions
Is liquidity the same as volume in trading?
No. Volume counts orders that have already executed; liquidity in the ICT sense counts resting orders that have not — stop losses and pending stops waiting at specific levels. Volume is a historical record, while a liquidity pool is future forced flow. High volume shows where business happened; a pool shows where price must eventually transact.
Can the same level be swept more than once?
Yes, but not immediately. A sweep spends the pool — those stops are gone. The level only becomes a target again after new positioning rebuilds it, which takes time and fresh touches. This is why a second run at a recently swept high often slices through cleanly: there is little resting there left to absorb.
How far beyond equal highs do stops usually sit?
Most retail stops cluster within a small buffer — a round number, a fixed pip amount, or a fraction of ATR beyond the level. That is why sweeps often extend roughly 5–15 pips past an FX level, or a few tenths of a percent in crypto, before rejecting. Treat these as illustrative tendencies and verify them on your own market and timeframe.
Does liquidity-based trading work outside forex?
The mechanism — stops clustering at obvious levels and price transacting into them — exists in any market with stop orders: indices, crypto, commodities, liquid stocks. Crypto's 24/7 schedule changes the session-pool map and thinner books exaggerate sweep wicks, but the buy-side and sell-side logic transfers directly wherever traders park stops at visible extremes.
Related query paths
Where to go next as you drill down from the liquidity map into specific pool types, setups, and execution models.
- BSL vs SSL in SMC: Identify Liquidity — the dedicated identification guide for marking both pool types accurately.
- Equal Highs & Equal Lows (EQH/EQL): Engineered Liquidity — a deep dive on the single most concentrated pool formation.
- Internal vs External Liquidity: An SMC Trader's Guide — how range-internal pools relate to the external extremes that dominate them.
- Liquidity Sweep Explained: The ICT Stop Hunt — the full anatomy of the harvesting event and how to trade its aftermath.
- Inducement vs Liquidity Sweep: A Trader's Guide to SMC Setups — telling the bait pool apart from the real harvest.
- ICT Top-Down Analysis: Multi-Timeframe Alignment — the workflow for aligning HTF pools with LTF execution.
- The Market Maker Model (MMXM): Buy and Sell Models Explained — how it connects to market maker model ict.
- what is a liquidity pool in ICT trading — Defines liquidity pools before explaining why price moves toward them.