
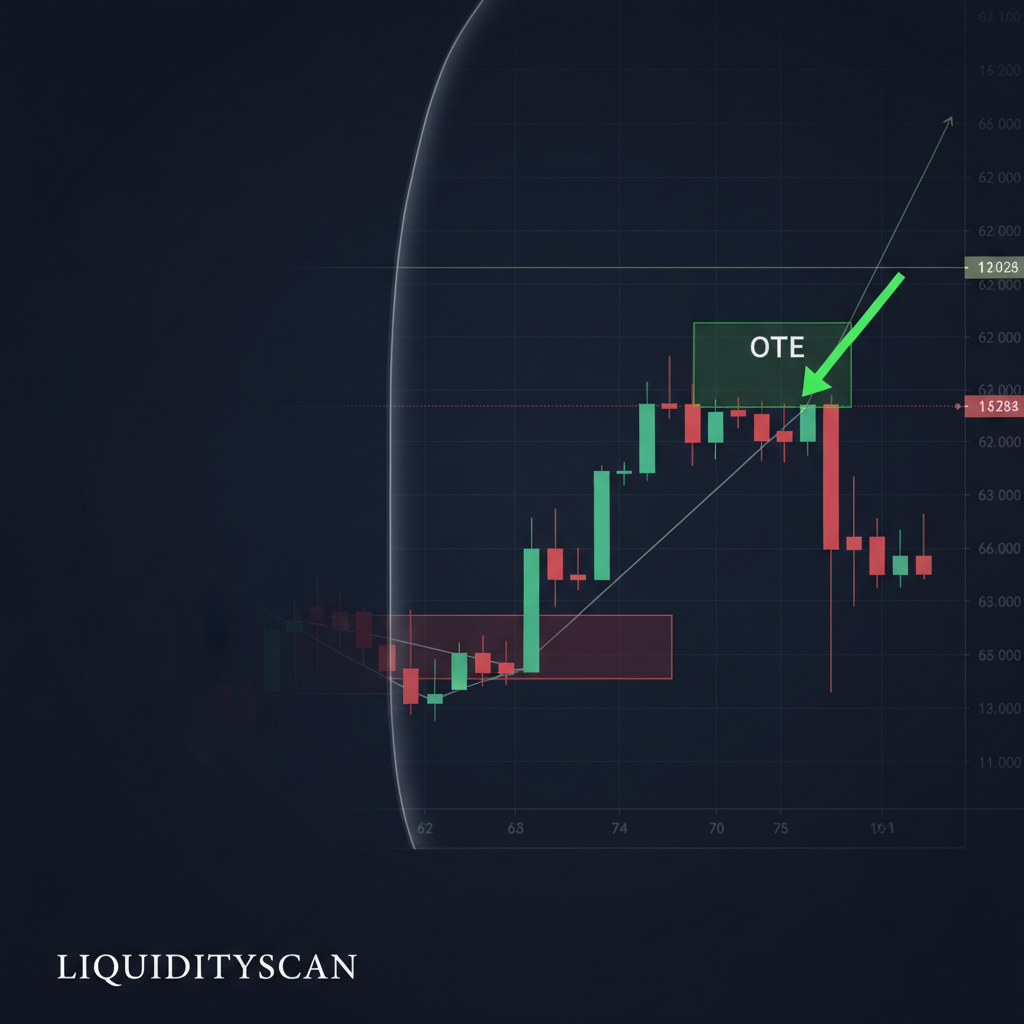
The Real Logic Behind OTE vs. Standard Fibonacci
Anyone can drag a Fibonacci tool across a chart. Almost nobody understands the algorithmic logic it's supposed to quantify. The retail version, usually leaning on 38.2% and 61.8%, gets slapped onto any visible swing with no thought for the character of the move underneath it. It's so routine that even major exchanges like the CME Group teach it as a generic technical tool.
OTE re-frames the whole thing. You're not fishing for a random retracement. You're locating a specific moment of institutional sponsorship, a hard push called displacement, and then waiting for an algorithmic re-pricing back into the range that move just created. The OTE gives you a calculated zone where that re-pricing tends to happen before the trend keeps going.
The key OTE levels are:
- 0.62 (62%): The shallowest entry point, often the first level of institutional interest.
- 0.705 (70.5%): Considered the "sweet spot" or equilibrium of the OTE zone. It's the midpoint between the 62% and 79% levels.
- 0.79 (79%): A deep retracement offering a highly favorable risk-to-reward ratio, often targeting liquidity resting just above or below the 70.5% level.
The difference that actually matters is the prerequisite. You don't draw an OTE on just any leg. It's only valid when it sits on a swing that produced a clear market structure shift (MSS) or break of structure (BOS). That initial move, riddled with fair value gaps, tells you a new dealing range has opened. The pullback into the OTE levels is the market quietly offering a deep discount (for longs) or a premium (for shorts) before it goes hunting for external liquidity.
| Aspect | Optimal Trade Entry (OTE) | Standard Fibonacci Retracement |
|---|---|---|
| Core Concept | Algorithmic re-pricing within a validated institutional range. | Generic mean reversion based on mathematical ratios. |
| Prerequisites | A displacement leg that creates a Break of Structure (BOS) or Market Structure Shift (MSS). | Any identifiable swing high and swing low. |
| Key Levels | 0.62, 0.705, 0.79. | 0.382, 0.50, 0.618. |
| Confluence | Requires alignment with other PD Arrays (Order Blocks, FVGs, Breakers). | Often used in isolation or with basic support/resistance. |
Building a High-Probability Setup with OTE Confluence
An OTE measurement on its own is useless. The numbers have no power until something else agrees with them. Their predictive value only shows up when they line up with other high-probability structures, and stacking those layers is the real work behind a complete trade idea, not just spotting a pattern.
Take a textbook short on GBP/USD during the London Open Kill Zone. Price has been coiling through the Asian session, parking buy-side liquidity above its highs. London opens, a Judas Swing rips through that liquidity, then snaps back hard with a big displacement candle to the downside. That move takes out the Asian low and hands you a clean Market Structure Shift.
Here's the process:
- Identify the Valid Range: The range is now defined from the high of the Judas Swing to the low of the displacement move that broke structure. This is the only range that matters.
- Measure for OTE: Draw your Fibonacci tool from the high to the low of this range. The software will project the 0.62, 0.705, and 0.79 levels back up inside the range. This entire area is your premium OTE zone for a short entry.
- Hunt for Confluence: This is the step that separates professional execution from guesswork. Scan inside that OTE zone. Is there a bearish order block sitting near the 79% level? Is there a prominent Fair Value Gap (FVG) whose midpoint aligns with the 70.5% level? This is where the setup gains its high-probability nature. A pullback to the 70.5% level alone is interesting; a pullback to a 70.5% level that is also the entry point of a 15-minute FVG is a high-conviction setup.
I've gone through thousands of setups like this, in backtests and live. The entries that produce the explosive moves almost always come down to this confluence. It's layered and data-driven, which is exactly why our LiquidityScan CISD (Change in State of Delivery) engine looks for the initial displacement first. It qualifies how institutionally significant the move is before it flags the resulting imbalances, giving you the foundational context an OTE entry needs.
Common OTE Pitfalls and How to Avoid Them
Even a sound model like OTE gets mangled in practice. Knowing where traders go wrong matters as much as learning the setup in the first place.
The most common mistake by a mile is drawing the Fib on the wrong swing. If the move didn't produce a clear break of structure with displacement, it's not a valid anchor, full stop. Hang it on a minor corrective swing inside a larger range and you're setting yourself up to fail. The OTE measures the retracement into the specific dealing range that actually shifted the market's intent, not just any leg that looks tidy.
Second, traders ignore the higher-timeframe story. A gorgeous bullish OTE on the 5-minute is a trap when the 4-hour and Daily are aggressively bearish and clearly reaching for lower prices. Your lower-timeframe entry has to agree with the draw on liquidity set by the higher timeframes. An OTE fired against dominant order flow is a low-probability bet, however perfect it looks in isolation.
Last, people get obsessed with the exact numbers. I used to do it too, parking a limit at 0.705 with a tight stop just above 0.79, then getting clipped by a millimeter before the trade ran hundreds of pips without me. The market routinely pokes past a key level to engineer liquidity before it turns, which is why your stop loss has to respect the structure, not the Fib level. Put it above the high (for shorts) or below the low (for longs) of the swing you're measuring. The OTE gets you into the right neighborhood; the PD array gives you the precise address.
OTE is not a shortcut. It's a precise way to quantify price inside an institutional framework. Stop treating it as a magic retracement tool, start using it to confirm an entry within a valid, displacement-driven range, and your execution gets sharper and more confident in a hurry.