
How Do You Trade the Power of Three on the Daily Candle?
To trade the Power of Three (PO3) on the daily candle, treat the daily open as your accumulation reference, wait for the manipulation leg to sweep liquidity against your higher-timeframe bias, then enter on the reversal back through the open toward the opposite draw.
This works because every daily candle is built in three phases. Learning how to trade Power of Three means learning to read those phases live instead of in hindsight, and to act only when the manipulation is complete.
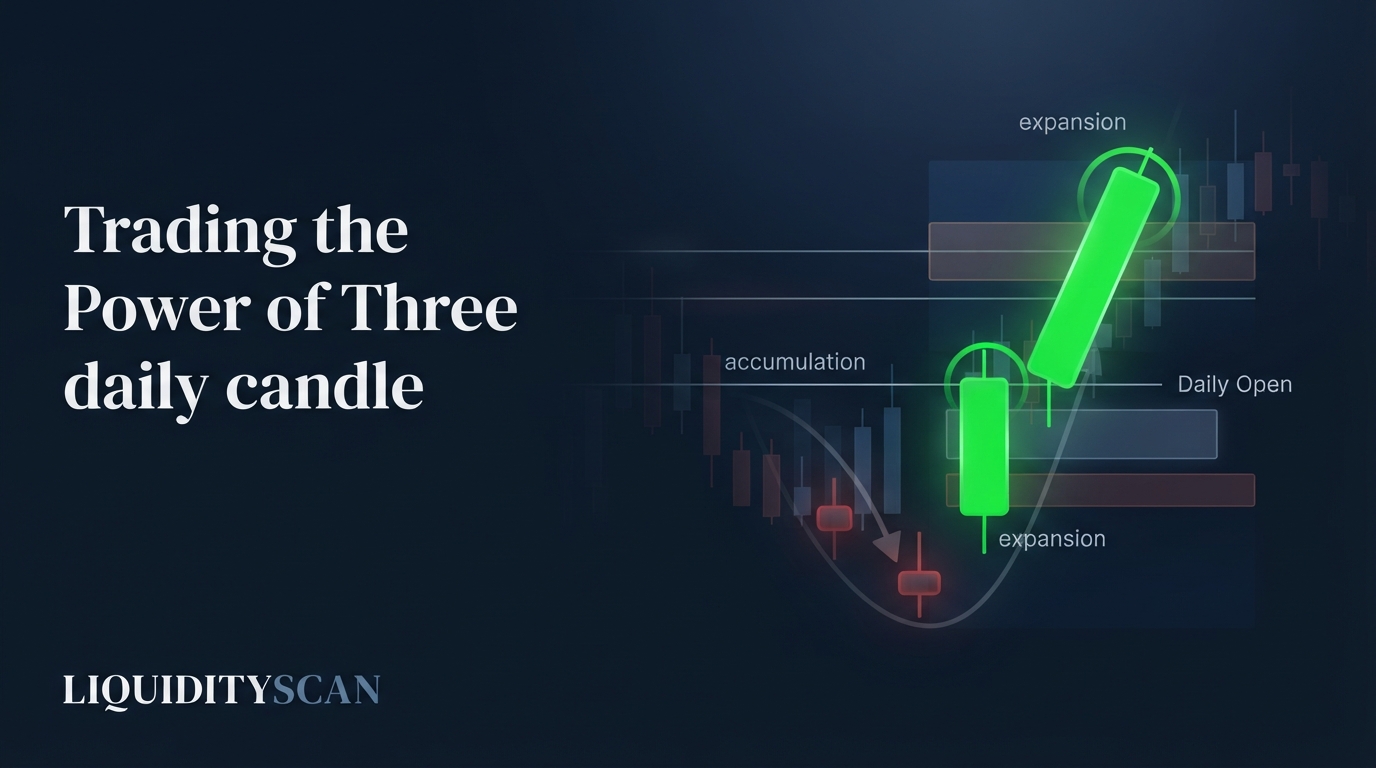
Quick recap of the AMD cycle (assume you know the theory): every candle and every session builds through Accumulation (a tight, indecisive range near the open), Manipulation (a stop-run in the wrong direction), and Distribution (the expansion that delivers price toward its true target). On the daily, those three legs usually map to distinct sessions.
The Step-by-Step Daily Power of Three Play
The daily candle gives you one clean PO3 per 24 hours. The edge is procedural: you are not predicting the top or bottom, you are waiting for the manipulation to hand you the direction, then entering with the algorithm rather than against it. Here is the exact sequence.
1. Determine the daily bias and draw (HTF)
Before the day starts, decide where price is likely delivering to. Read the weekly and daily structure: are you in a premium or discount relative to the dealing range, and which side holds the obvious liquidity?
That opposite pool, an old high or low, equal highs, or an unfilled gap, is your Draw on Liquidity (DOL). Bias without a specific draw is not tradeable.
Useful bias inputs: the last decisive daily Break of Structure (BOS), whether the prior daily candle closed in premium or discount, and where the nearest unmitigated HTF arrays sit. If those agree, conviction is high; if they conflict, expect a range day where the PO3 is messy and worth skipping.
2. Mark the daily open and midnight open
Plot the daily open and the midnight (00:00 New York) open. These are your accumulation references. Distribution typically delivers away from the open toward the draw, while manipulation pokes to the wrong side of it first. When price is coiling around these levels early, you are watching accumulation, not a setup.
3. Wait for the manipulation leg to complete
The manipulation is a sweep against your bias, usually during the London session or early New York. If your bias is bullish, expect a dip below the open or a prior low to run sell-side stops. Do not act while it is extending. You want the sweep, the rejection, and the first sign that price is reclaiming the level.
4. Enter on the reversal through the open with LTF confirmation
Drop to a lower timeframe (5m or 15m) and wait for a shift: a Market Structure Shift (MSS) back through a short-term swing, a clean Fair Value Gap (FVG) left by the displacement, or a refined Order Block at the sweep origin.
Enter on the retracement into that array as price re-crosses the daily open toward your bias. Confirmation is what separates an entry from a guess.
5. Target the opposite draw on liquidity
Your take-profit is the draw you mapped in step one, the buy-side or sell-side pool on the far side of the range. Distribution is the leg that reaches for it. Partial at interim liquidity if you want, but the daily PO3 is designed to carry you to the true target, not to a scalp.
6. Place the stop beyond the manipulation extreme
Your invalidation sits just past the wick of the manipulation sweep. If price trades back through the extreme that supposedly ran the stops, the read was wrong, the accumulation reference did not hold, and you are out cheap. Because the sweep created a clean swing point, this stop is both logical and tight relative to the run to the draw.
How to Read Accumulation, Manipulation, and Distribution in Real Time
The hard part of learning how to trade Power of Three is telling the phases apart before the candle closes. Hindsight is easy; live reading needs behavioral cues.
- Accumulation looks like compression: overlapping candles, small ranges, and repeated failure to leave the daily open. Volume and displacement are absent. Nothing has committed yet.
- Manipulation is a fast, one-directional poke that takes an obvious level, then stalls. The tell is a liquidity run with no follow-through, a sweep that immediately gets rejected rather than expanding.
- Distribution is displacement: a wide-range candle or series that leaves an FVG, breaks short-term structure, and holds its direction. This is the only phase you want to be entering into.
The single most useful question: did that move take liquidity and stall, or did it break structure and run? A stall after a sweep is manipulation. A structure break with displacement is distribution beginning.
Two more real-time tells sharpen the read. First, watch the reaction candle after the sweep: a long wick that closes back inside the range says liquidity was absorbed and rejected, the fingerprint of a completed manipulation leg.
Second, watch how the FVG behaves: distribution respects the gap it just created on the retrace, while a failed move fills straight back through it. Automated scanners can flag the displacement and gap the instant they print, which is where a tool like LiquidityScan saves you from staring at a chart through the whole Asian range.
Timing: Which Sessions Run Each Phase
The daily PO3 is a time-based model, so anchoring the phases to sessions is half the edge. A common weekday template for a New York-driven day:
- Accumulation forms during the Asian session, price ranges quietly near the midnight open.
- Manipulation fires in the London kill zone or the early New York window, running the Asian high or low against the day's true direction, the classic Judas Swing.
- Distribution delivers through the New York AM session toward the draw.
This is a template, not a law. Some days the manipulation lands at the New York open instead. The point is that each phase clusters in a predictable window, so you know roughly when to expect the sweep and when to be hunting the entry rather than staring at a dead Asian range.
Time and price together, not price alone, are what make the daily PO3 tradeable.
Applying the Power of Three Fractally
PO3 nests. The weekly candle runs its own Power of Three, and each daily candle inside it is a smaller PO3. In a bullish weekly profile, Monday and Tuesday often supply the weekly manipulation, the low of the week, while later days distribute upward. That weekly manipulation day is itself a daily PO3 whose own manipulation leg sweeps in London.
Practically, this means your daily setup has more conviction when it aligns with where the higher candle is in its own cycle. A daily bullish PO3 that fires on the day the weekly candle is completing its accumulation-to-distribution turn is a stacked-timeframe trade, not an isolated one.
The nesting also explains counter-bias days. If the weekly is bullish but Monday prints a bearish daily PO3, that daily distribution down is often just the weekly manipulation leg forming the low of the week.
Reading the two cycles together keeps you from mistaking a lower-timeframe distribution for a genuine trend change, and tells you the higher-conviction long is waiting later in the week once the weekly sweep completes.
A Worked Daily-Candle Example
Take a hypothetical EURUSD day with a daily open at 1.0850. Your weekly read is bullish, price sits in discount, and the obvious draw is a pool of buy-side liquidity at last week's high near 1.0940.
- Accumulation: through the Asian session, price grinds between 1.0845 and 1.0858, hugging the open. No displacement, no commitment. You do nothing.
- Manipulation: at the London open, price drives down to 1.0822, sweeping the previous day's low and the sell-side stops resting below it, then stalls. The move ran liquidity but showed no continuation. This is the Judas Swing against your bullish bias.
- Confirmation and entry: on the 5m, price reclaims 1.0840 and prints an MSS through a short-term high, leaving an FVG between 1.0838 and 1.0845. You enter on the retrace into that gap at ~1.0842, the reclaim of the daily open confirming the shift back toward your bullish bias.
- Stop: just below the manipulation wick at 1.0818, past the swept low.
- Distribution and target: New York AM expands price upward, delivering into the 1.0940 draw. Risk was roughly 24 pips; the run to target was near 98 pips, a clean multiple, because the entry sat at the origin of the distribution leg.
Every level here is illustrative, but the structure, sweep against bias, reclaim of the open, displacement to the draw, is the repeatable skeleton of the daily play.
Invalidation and Common Mistakes
Not every day gives a Power of Three you can trade. Know when to stand down.
- No manipulation sweep: if price never runs a level against your bias and simply trends from the open, there is no clean accumulation reference to enter from. Forcing an entry into an already-extended move is chasing distribution, not trading it.
- Trend day / expansion open: on high-impact news or strong trend days, the manipulation can be shallow or absent and distribution starts at the open. These days invalidate the classic template; sit out or wait for the next daily candle.
The recurring mistakes that wreck this model:
- Entering during manipulation, thinking it is distribution. The sweep is fast and convincing, and traders join it in the wrong direction right before it reverses. Wait for the reclaim and structure shift.
- Trading the wrong bias. If your HTF read is inverted, every manipulation looks like a valid entry in the losing direction. Anchor bias to structure and the draw, not to how the last hour felt.
- Ignoring time. Taking a "sweep" outside the expected windows often means you are reacting to noise, not the algorithmic manipulation leg.
Mastering how to trade the Power of Three on the daily candle comes down to patience: let accumulation build, let the manipulation sweep run against you, then enter the distribution leg toward the draw with your stop tucked safely beyond the extreme the algorithm already used.
Frequently Asked Questions
What timeframe should I use to trade the daily Power of Three?
Read bias and the draw on the daily and weekly, mark the daily and midnight opens on the daily, then drop to the 5m or 15m for the manipulation sweep and entry confirmation. The daily frames the trade; the lower timeframe times the entry.
Does the Power of Three only work on the daily candle?
No. PO3 is fractal, it repeats on weekly, daily, and session candles. The daily is popular because it produces one clean, high-conviction cycle per day and aligns with the London and New York kill zones where the manipulation leg typically fires.
How do I know if the sweep is manipulation or a real breakout?
Manipulation takes liquidity and stalls with no follow-through, then reverses back through the level. A real breakout displaces, breaks structure, and holds direction. If a sweep against your bias immediately gets reclaimed, it was manipulation, not a trend continuation.
Where exactly do I place my stop on a Power of Three trade?
Just beyond the extreme of the manipulation sweep, past the wick that ran the stops. If price trades back through that level, the accumulation reference failed and your directional read is invalid, so you exit at a small, pre-defined loss.
Related query paths
Follow the daily Power of Three from the underlying cycle to the entry mechanics and target:
- ICT Power of 3 (PO3): The AMD Cycle Explained — the concept behind the play: how accumulation, manipulation, and distribution actually work.
- ICT Daily Bias: How to Determine It — nail step one so your manipulation reads point the right way.
- What Is the Judas Swing in ICT Trading? — a deeper look at the manipulation leg that sets up the entry.
- ICT Kill Zones Complete Guide: A Pro Trader's Framework — the session windows where each PO3 phase fires.
- Liquidity Sweep Then MSS: Reversal Guide — the exact sweep-to-confirmation sequence you enter on.
- Draw on Liquidity (DOL) in ICT — how to pick the target the distribution leg delivers to.
- How to Trade ICT/SMC with a Full-Time Job — a related angle on how to trade ict with a full time job.