▸ CATEGORY · MARKET STRUCTURE
Market Structure
Articles filed under "Market Structure" — deep analysis from LiquidityScan Research.

Is Market Structure Subjective? Removing Bias from Structure Reading
Market structure is partly subjective, but almost all of that subjectivity is reducible. Swing selection and timeframe choice introduce discretion; a fixed ruleset removes most of it, so two skilled traders reading the same rules should agree most of the time.
 Hayk Muradian·
·11 min
Hayk Muradian·
·11 min
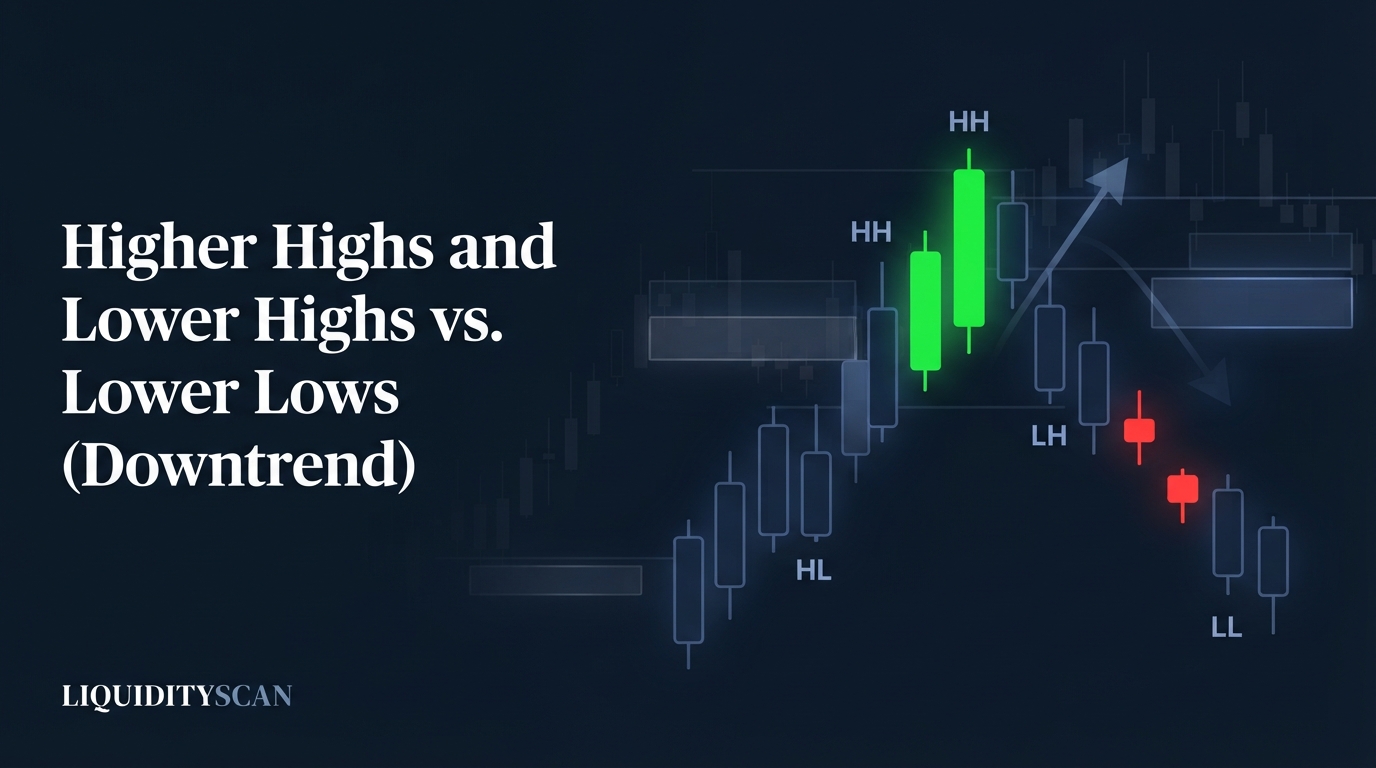
Higher Highs and Higher Lows vs Lower Highs and Lower Lows: Reading Trend Structure
An uptrend prints higher highs and higher lows together; a downtrend prints lower highs and lower lows together. When the two series stop agreeing, structure is transitioning — and that disagreement, not any indicator, is the earliest objective trend signal on the chart.
Hayk Muradian·
·11 min
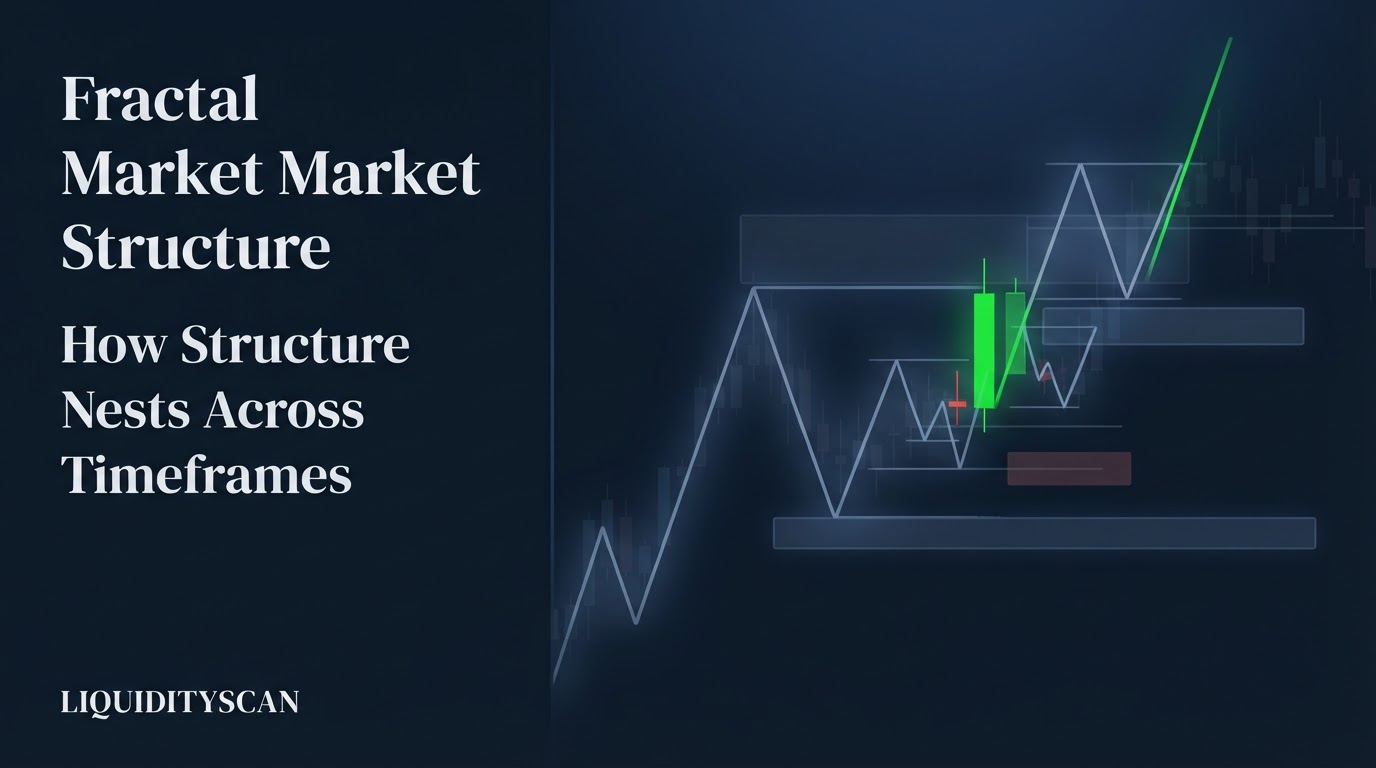
Fractal Market Structure: How Structure Nests Across Timeframes
Market structure is fractal: the same swing-high/swing-low geometry that defines a trend on the weekly chart repeats on the 4H, the 15m, and the 1m. Here is why order flow is self-similar, the mapping rules that connect timeframes, and how ICT traders turn nesting into entry precision.
Hayk Muradian·
·10 min

Does Break of Structure Actually Work? A Data-Driven Look at BOS Reliability
Unfiltered, a break of structure is close to a coin flip after costs, because loose rules count every micro-break as structure. Filtered for swing significance, candle-close confirmation, displacement, and HTF alignment, the same event tests meaningfully better. Here is the evidence.
Hayk Muradian·
·10 min
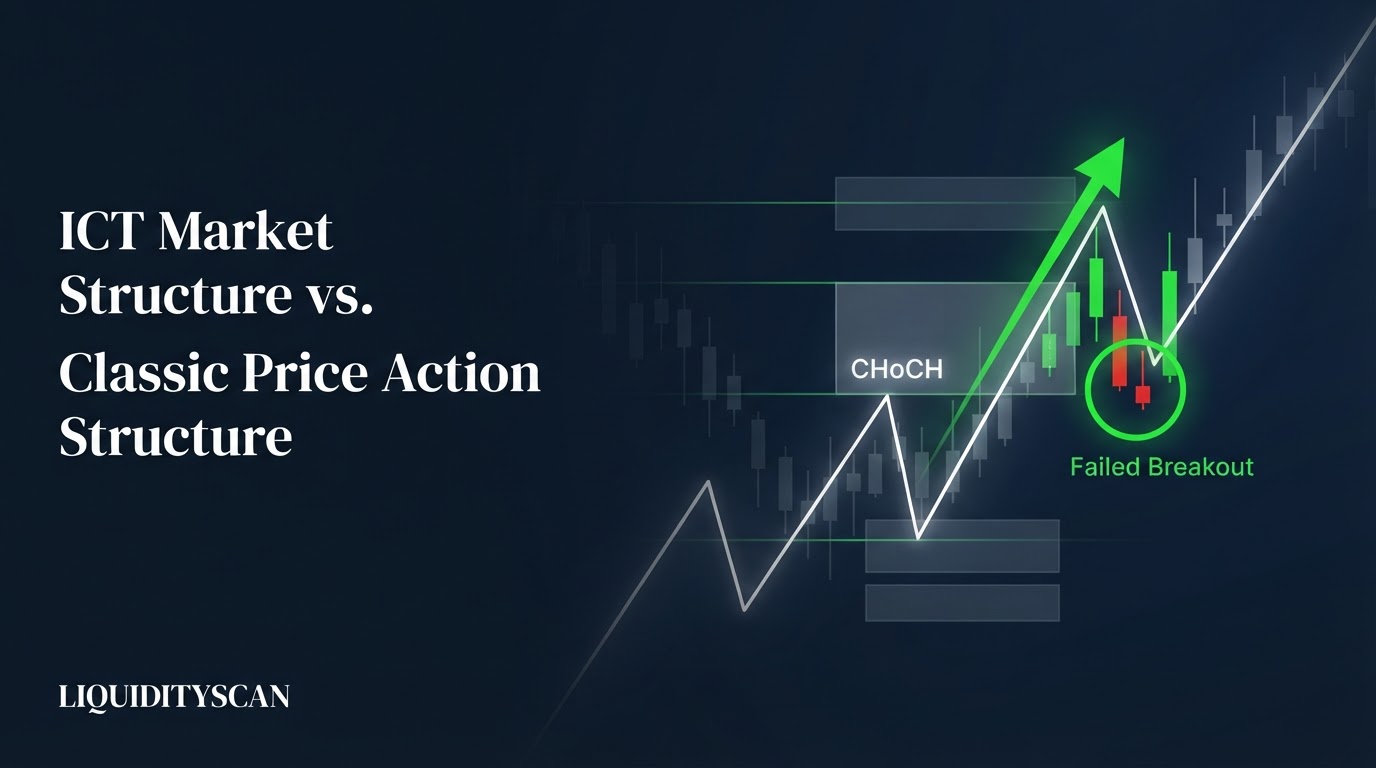
ICT Market Structure vs Classic Price Action Structure: What Changed?
ICT kept Dow theory's skeleton — higher highs and higher lows still define trend — but changed why structure breaks, what confirms one, and when it matters. The failed breakout a classic trader avoids is a completed liquidity sweep an ICT trader trades the other way.
Hayk Muradian·
·13 min
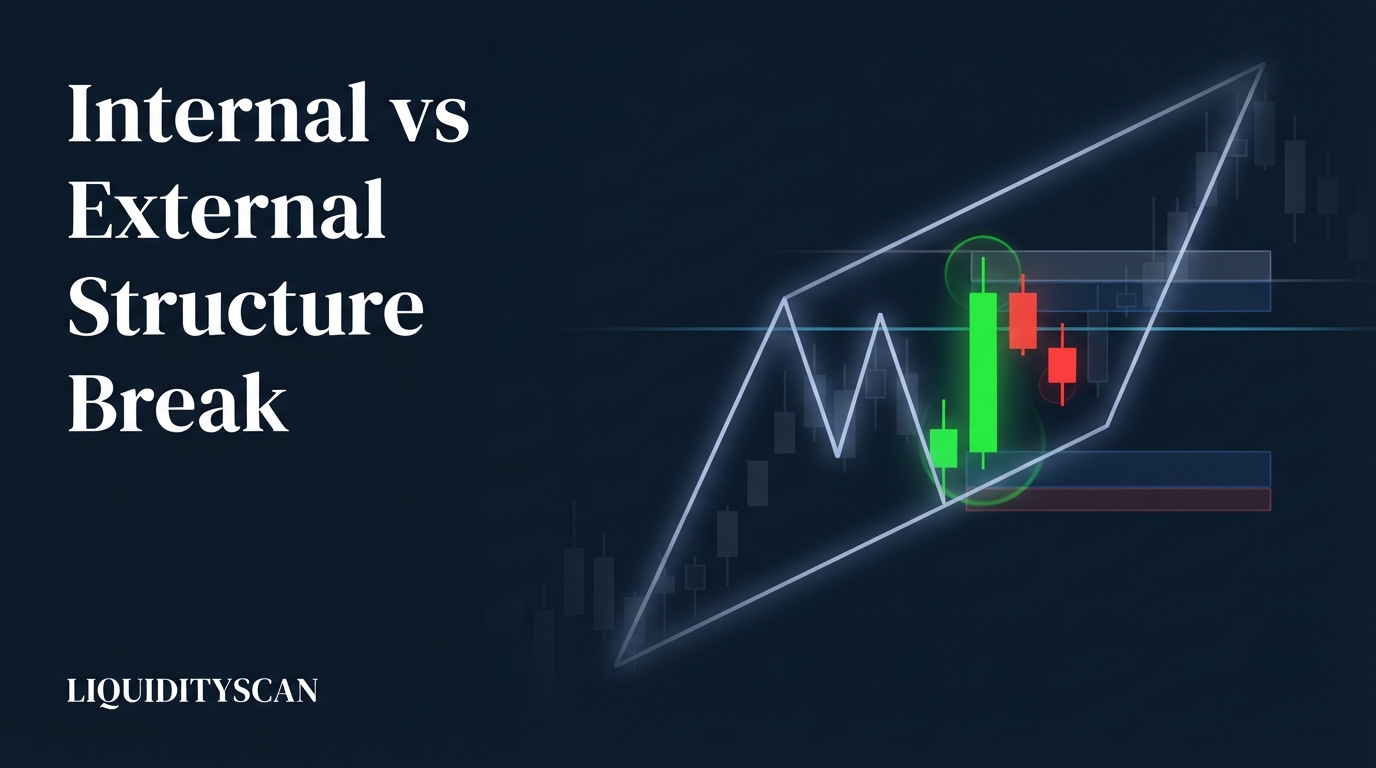
Internal vs External Structure Break: Which One Should You Trade?
External structure is the swings that define your dealing range; internal structure is everything printed inside it. Trade internal breaks as entries in the direction of external structure — and treat internal breaks against it as inducement until the range extreme actually gives way.
Hayk Muradian·
·11 min
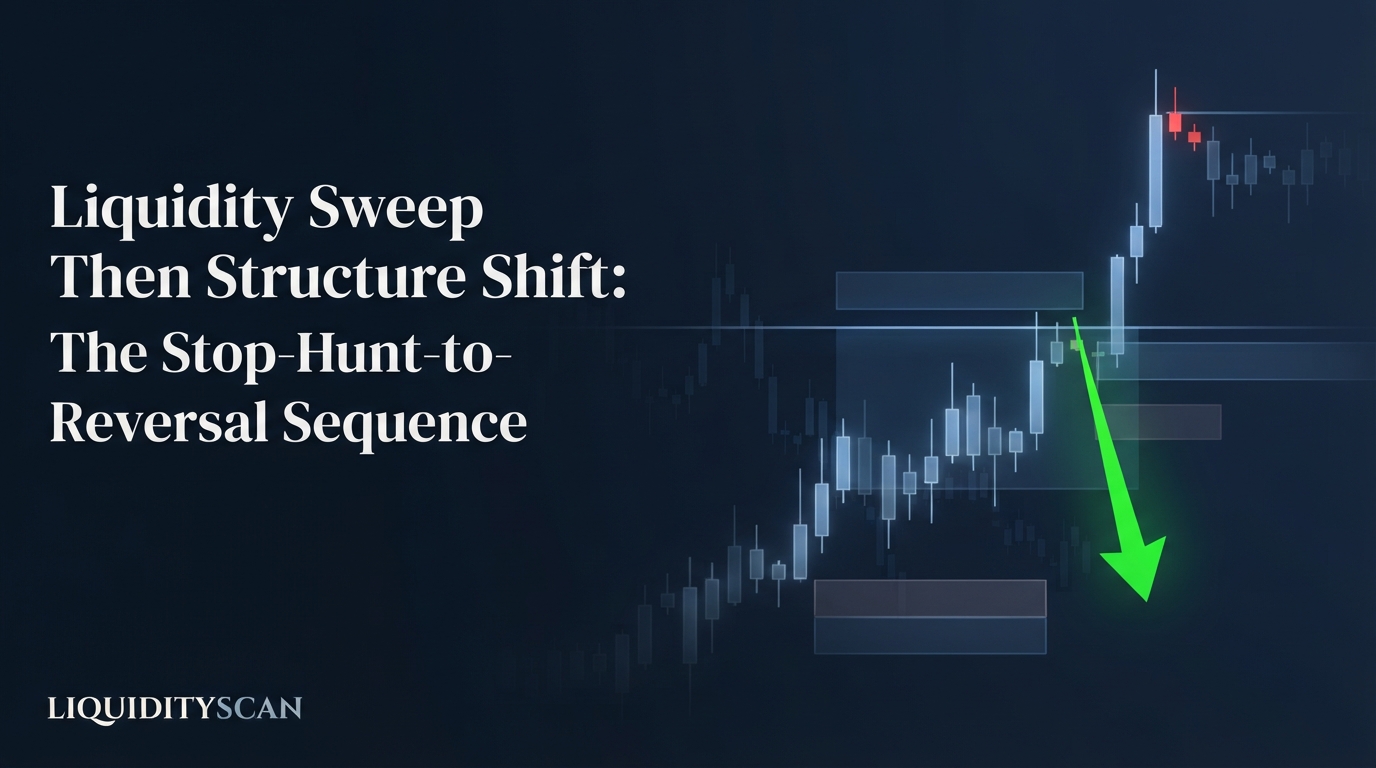
Liquidity Sweep Then Structure Shift: The Stop-Hunt-to-Reversal Sequence
A liquidity sweep alone is a suspicion; a sweep followed by a market structure shift is a confirmation. Here is ICT's highest-probability reversal signature broken down step by step — the level, the sweep, the displacement, the MSS — with entries, stops, targets, and the R math.
Hayk Muradian·
·11 min

What Is Institutional Order Flow and How Does Structure Reveal It?
Institutional order flow is the aggregate directional intent of large participants, and ICT traders read it from price structure itself: displacement legs, unmitigated order blocks and FVGs, and the swing sequence. Structure records what size already did, and that record becomes your bias.
Hayk Muradian·
·12 min
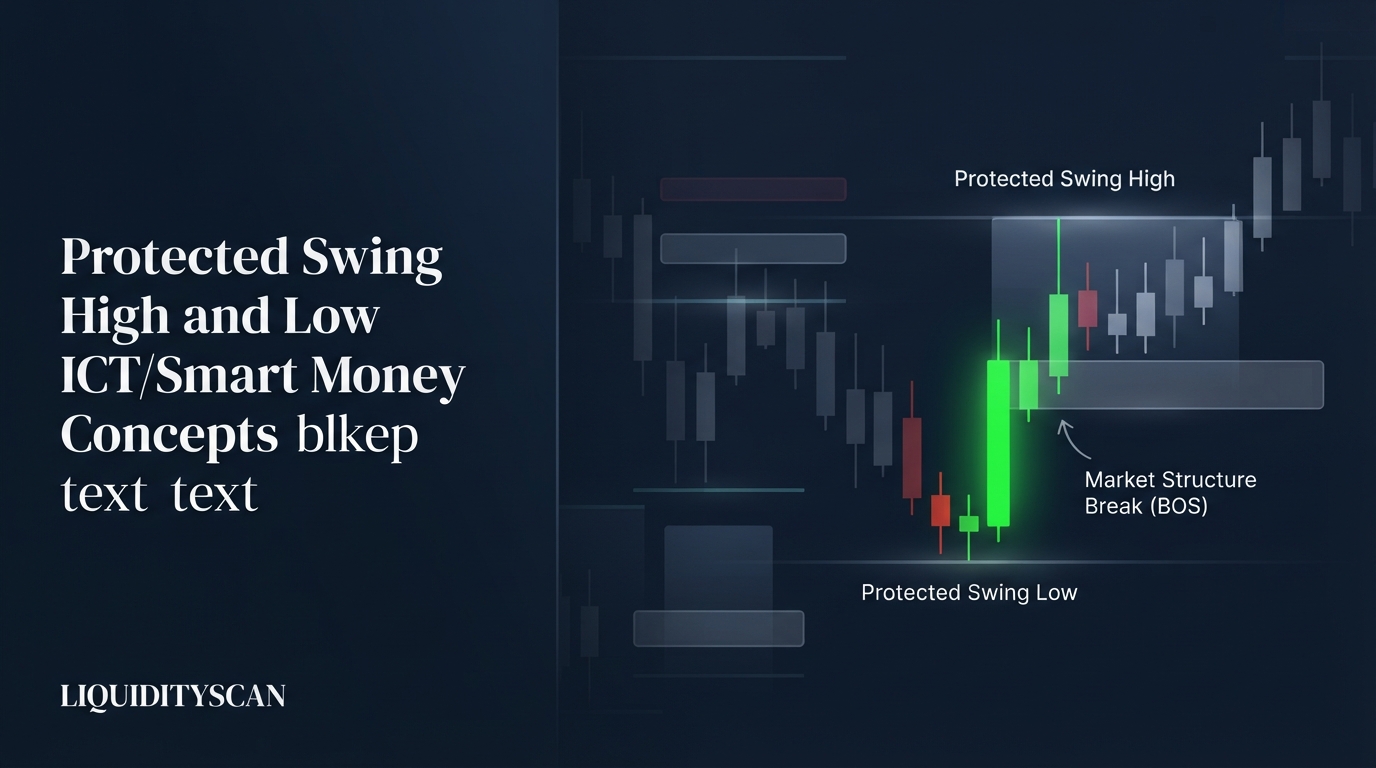
What Is a Protected Swing High and Low in ICT?
A protected swing is the high or low the market must defend for the current ICT structure to stay valid. It forms when a raid on liquidity is followed by displacement that breaks structure; while it holds the trend read is intact, and a close through it flips the narrative.
Hayk Muradian·
·12 min

What Is a Swing High and Swing Low in ICT? The 3-Candle Rule
A swing high forms when a candle's high is above the highs of the candles on either side of it; a swing low is the mirror image. This 3-candle rule is the atomic unit of ICT market structure — every BOS, CHoCH, and liquidity pool is built from these points.
Hayk Muradian·
·10 min
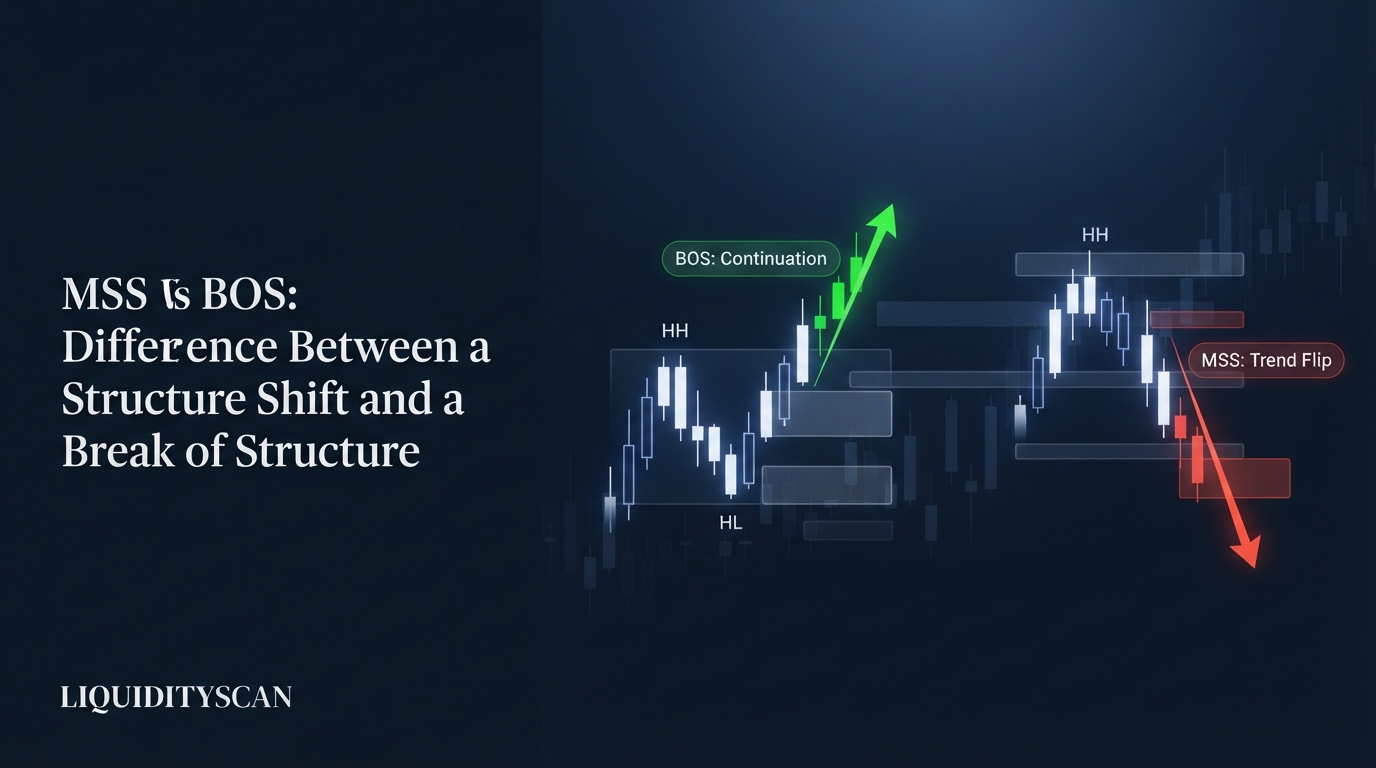
MSS vs BOS: The Difference Between a Structure Shift and a Break of Structure
A BOS breaks structure in the direction of the trend and confirms continuation. An MSS breaks the opposite-side swing with displacement and flips the trend. Same event type, opposite meaning.
Hayk Muradian·
·10 min
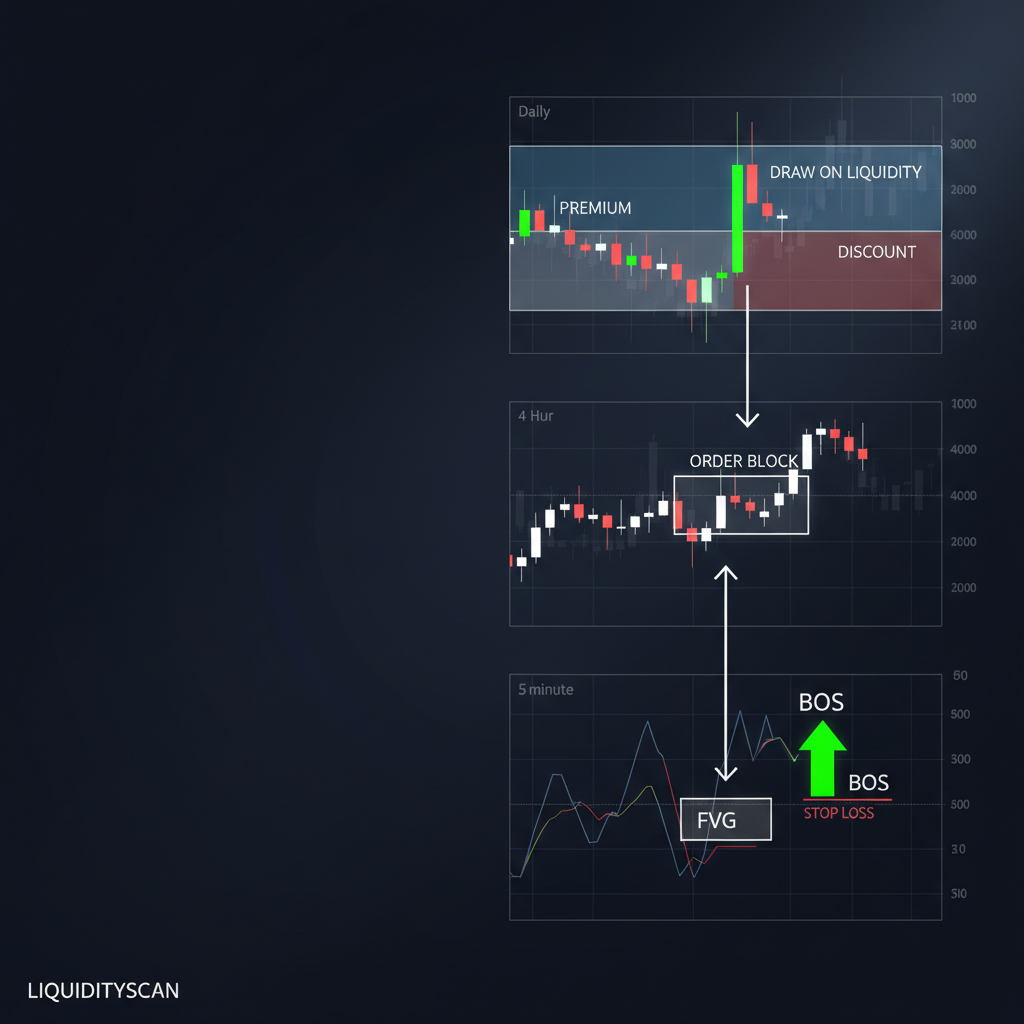
Best ICT Timeframes: HTF Bias to LTF Entry Guide
The best ICT timeframes aren't one setting — they're a pair. HTF sets bias and draw, LTF times the entry. Here's how to match them.
Hayk Muradian·
·5 min
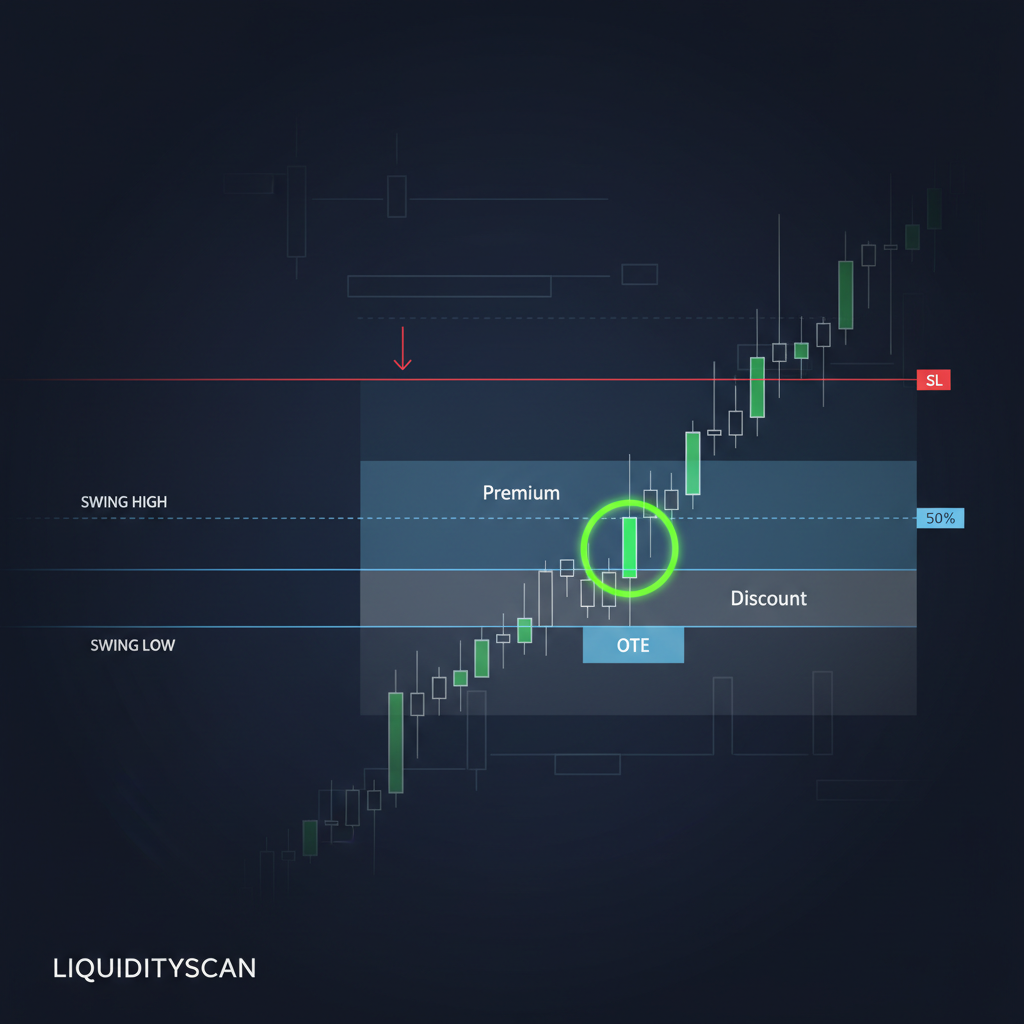
How to Draw a Dealing Range in ICT (Correctly)
A dealing range is only useful if its two anchors took liquidity. Here is how to draw one correctly and know when it dies.
Hayk Muradian·
·5 min
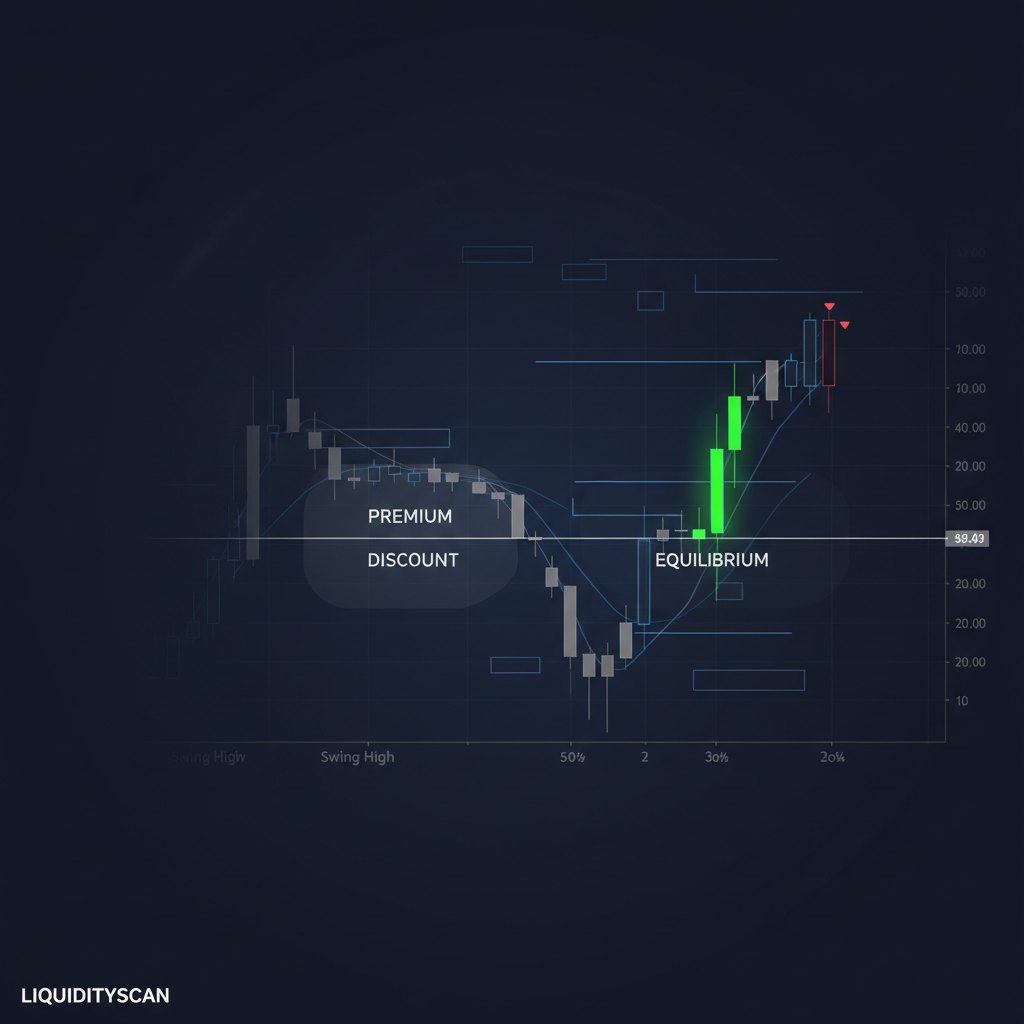
How to Draw Premium & Discount Zones (ICT Guide)
Premium and discount zones start with one correct swing high and swing low. Get the dealing range right and the 50% line does the rest.
Hayk Muradian·
·5 min

CHoCH vs MSS: Stop Confusing These Two
CHoCH and MSS are not synonyms. One flags a warning inside structure; the other confirms intent with displacement. Here's the precise line between them.
Hayk Muradian·
·5 min
How to Map Market Structure Top-Down: A Step-by-Step Method
To map market structure, work top-down: mark the HTF swings first, read the trend, find the dealing range and draw on liquidity, then drop to the LTF only around your point of interest. HTF sets bias; LTF times entry.
Hayk Muradian·
·10 min
Not trading advice. LiquidityScan publishes educational content for informational purposes only. Trading involves substantial risk of loss.