
What Do Higher Highs and Higher Lows Mean?
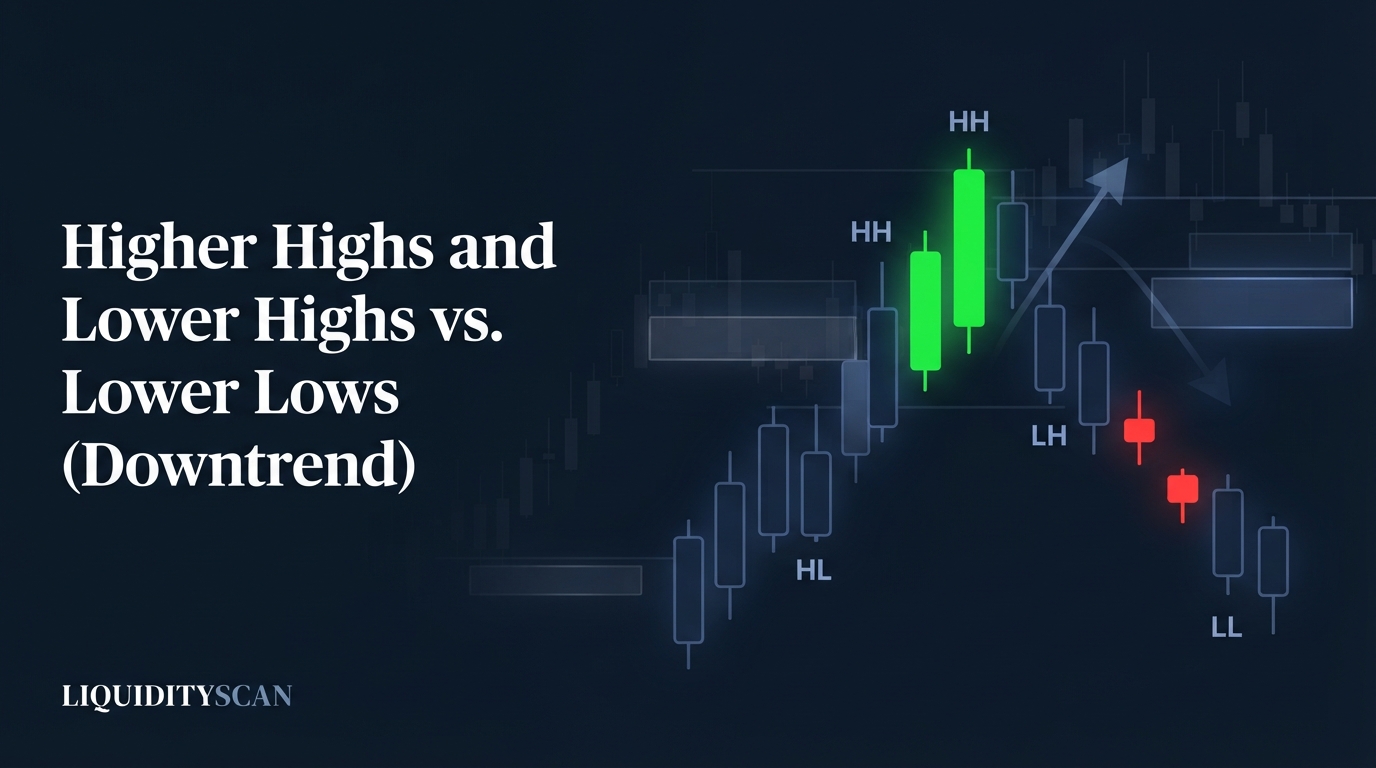
Higher highs and higher lows (HH/HL) mean every successive swing high and every successive swing low prints above its predecessor — the structural definition of an uptrend. Lower highs and lower lows (LH/LL) mean both series step down — the structural definition of a downtrend.
The unit of measurement is the swing point. A swing high is a pivot whose high exceeds the candles on either side of it; a swing low is the mirror image. Most ICT traders confirm pivots with a three-candle fractal rule, so every chart and every session produces the same swing set instead of a subjective squiggle.
Once the pivots are marked, trend structure reduces to two independent data series: the sequence of highs and the sequence of lows.
The idea predates every indicator on your platform — Charles Dow was describing rising peaks and troughs in the 1890s — but Smart Money Concepts (SMC) added a second layer: each swing point is also a liquidity pool, which changes what professionals do at those prices.
The counting still comes first, because every downstream decision — bias, entries, invalidation — inherits its quality from the count.
Why Higher Highs Without Higher Lows Signal Weakness
A trend is only valid when both series agree. Rising highs prove buyers can absorb the supply that appears at new price extremes; rising lows prove buyers are willing to pay progressively more on every pullback. Remove either half and the diagnosis changes completely.
- Higher highs with equal lows: the ceiling is rising but the floor is not. Each pullback returns to the same shelf, which means demand is defending a level rather than advancing. Worse, those Equal Lows (EQL) stack sell stops at a single price — an engineered magnet that price frequently runs before any sustained continuation.
- Higher highs with lower lows: the series openly disagree. That is not a weakening trend; it is no trend at all — an expanding range in which both sides of the book are being swept.
- Flat highs with higher lows: ascending compression into a ceiling. Pressure favors an upside resolution, but structurally it remains a range until the high series actually breaks.
The operational rule: never grade a trend from one series. A chart that keeps printing new highs while its lows flatten or slip is not trending — it is distributing, and the two-series read exposes that long before a moving average rolls over.
The Four Market Structure States
Combine the two series and every chart, on every timeframe, sits in exactly one of four states. The sequences are unambiguous, which is the point — structure states are readable without a single indicator on the chart.
| State | Swing highs | Swing lows | Signature sequence | Practical read |
|---|---|---|---|---|
| Trending up | Rising (HH) | Rising (HL) | HL → HH → HL → HH | Buy pullbacks; trend intact while the last HL holds on a closing basis |
| Trending down | Falling (LH) | Falling (LL) | LH → LL → LH → LL | Sell retracements; trend intact while the last LH holds |
| Contracting range | Falling (LH) | Rising (HL) | LH and HL converging | Coil; stops build on both sides; trade the expansion, not the chop |
| Expanding range | Rising (HH) | Falling (LL) | HH and LL diverging | Both sides being swept; worst trend-following conditions available |
The two range states deserve respect because they punish trend tools. A contracting range — lower highs pressing into higher lows — compresses stops on both sides into an ever-tighter coil, and the eventual break tends to be violent because both pools get taken in sequence.
An expanding range — higher highs and lower lows together — is the market openly harvesting both sides. It is common around high-impact news and late-cycle distribution, and it manufactures textbook-looking breakouts in both directions that fail.
From Higher Lows to Lower Lows: Pullback or Reversal?
Structure answers this question mechanically. A pullback is any decline that holds above the last confirmed higher low; a reversal is a decline that closes through it. You do not need to predict which one you are watching — you need to know the single price that separates them, and the structure count hands you that price in advance.
The three-step transition
- Failure at the highs. The advance stalls: price prints a marginal higher high — often just ticks above the prior peak — or a lower high outright. A marginal HH that immediately rejects is frequently a sweep of resting buy stops rather than genuine continuation.
- The first lower low: warning, not confirmation. The first LL after an HH/HL sequence tells you the buyers who defended every prior pullback did not show up this time. The odds have shifted; the trend label has not.
- Break of the prior higher low: confirmation. When price closes through the higher low that preceded the final high, the up-structure is objectively broken. This is the logic behind a Change of Character (CHoCH). Breaks in the direction of the standing trend are Break of Structure (BOS) events and signal continuation, not reversal.
Two qualifiers separate professionals from label-chasers. First, wick versus close: a wick through a higher low that reclaims the level within a candle or two is usually a Liquidity Sweep — stops were harvested and structure survived.
Second, Displacement: a CHoCH delivered by a full-bodied, energetic down leg carries real information, while a drift through the same level on shrinking ranges frequently mean-reverts.
The Liquidity Layer: Every Higher Low Is a Stop Pool
Classical technical analysis stops at the labels. ICT's contribution is to ask who has orders resting at each swing.
Below every higher low sit the protective stops of longs who bought the pullback — Sell-Side Liquidity (SSL). Above every lower high sit the buy stops of shorts — Buy-Side Liquidity (BSL). Swing points are not lines on a chart; they are order clusters.
This reframes how trends end. A mature uptrend has stacked a ladder of sell-side pools beneath each successive higher low.
Participants who need to sell size cannot do it into a thin book at the top, so the terminal sequence is engineered: a final push above the old high collects buy stops and breakout entries, then price delivers down through the ladder, pool by pool.
The trend does not die of exhaustion — it ends by design, because its own structure built the exit liquidity. In ICT terms, the Draw on Liquidity flips from the highs to the ladder of lows.
The same logic explains Inducement: a small, obvious higher low that forms just above a genuine point of interest exists to attract early longs whose stops are then run to fill institutional orders at the level below. Practically, this changes two habits.
Stops belong beyond sweep distance of the swing, not one tick under it, and a terminal higher high should be treated as a candidate sweep until displacement proves otherwise.
Common Counting Errors That Corrupt the Read
Three errors account for most bad structure reads, and all three are procedural — which means all three are fixable with rules rather than talent.
Counting minor swings as structure
Not every wiggle is a swing. Inside a single up leg there are dozens of small pivots, and treating them as structural turns the count into noise.
Separate internal structure — pivots inside the current leg — from external structure, the swings that define the leg itself. Define the pivot rule once (the three-candle fractal is the common standard) and only external swings receive HH/HL/LH/LL labels on your trade frame.
Re-labeling mid-formation
A swing high does not exist until the right-hand candles have closed below its high; until then it is a candidate. Traders who label live candles end up moving their marks to fit the trade they already want — curve-fitting in real time.
Label on confirmation, then leave the label alone. If the count changes depending on your position, you do not have a count; you have a bias.
Mixing timeframes in one count
Each timeframe owns its own series. A 4H lower low does not overwrite a weekly higher low, and jumping between charts to find the label you prefer destroys the read.
Keep one count per timeframe, then stack them deliberately: weekly HH/HL with 4H LH/LL is not a contradiction — it is a retracement inside an uptrend, and it usually means the 4H downtrend is delivering price into the zone where the next weekly higher low wants to form.
That confluence — higher-timeframe trend plus lower-timeframe counter-structure into a discount — is the highest-probability long context in the ICT playbook.
Consistency is the hard part, which is where automation earns its keep: LiquidityScan's market structure scanner applies one fixed swing rule across every timeframe and labels BOS and CHoCH events the moment they confirm, so the count never bends to a bias.
Worked Example: Labeling a 10-Swing BTCUSDT Sequence
Take a described 4H BTCUSDT sequence and label every swing as it confirms. Price begins basing after a decline:
- Swing low at 60,000 — the anchor low. No trend label yet; the first two pivots only establish reference points.
- Swing high at 63,000 — the anchor high.
- Swing low at 61,500 — holds above 60,000: the first higher low.
- Swing high at 65,200 — clears 63,000 with a full-bodied close: the first higher high and a confirmed BOS. The uptrend is now objective: HL plus HH.
- Swing low at 63,400 — above 61,500: higher low. Stops now stack beneath 63,400 and 61,500; the sell-side ladder is building.
- Swing high at 67,800 — higher high, second BOS. Textbook HH/HL rhythm.
- Swing low at 64,900 — higher low, but note the depth: this pullback retraced further into the prior leg than the previous one did. Not a signal by itself; worth logging.
- Swing high at 68,100 — technically a higher high, but only about 0.4% above 67,800, and the candle that printed it closed back below the old high. Step one of the transition: a marginal HH behaving like a buy-side sweep.
- Swing low at 64,100 — closes below 64,900: the first lower low and a confirmed CHoCH, because the higher low that preceded the final high is broken on a closing basis. The up-structure is dead.
- Swing high at 66,300 — fails under 68,100: the first lower high. Both series now point down — LH plus LL — and the first draw sits at the 63,400 pool, with 61,500 behind it.
Ten swings, one framework, no indicator involved. That is the entire discipline of reading higher highs and higher lows against lower highs and lower lows: confirm both series, respect the last higher low as the line between pullback and reversal, and treat every swing you label as a pool someone intends to spend.
Do that consistently and trend structure stops being an opinion and becomes a measurement.
Frequently Asked Questions
Is a higher low the same thing as support?
No. Support is a horizontal zone expected to hold on repeated tests; a higher low is a single confirmed pivot in a rising series and is rarely retested in a healthy trend. When a level is tested repeatedly it builds equal lows — stacked stops that attract a sweep — which is closer to a liability than to strength.
How many swings does it take to confirm an uptrend?
The minimum objective sequence is four pivots: an anchor low, an anchor high, a higher low, and a close above the anchor high — the first confirmed higher high. Before that break you have a candidate, not a trend. Many traders also require a second higher low to prove the new structure can defend a pullback.
Can price make higher highs and lower lows at the same time?
Yes — that is an expanding or broadening range, the fourth structure state. Each rally takes out buy stops above the prior high and each decline takes out sell stops below the prior low. It typically appears around high-impact news or late-cycle distribution and is the worst environment for breakout and trend-following entries.
Does the HH/HL framework work on low timeframes and crypto?
The logic is fractal, so the labels apply from monthly charts down to one-minute charts and across asset classes, crypto included. Reliability drops as the timeframe shrinks because spread, funding events, and single large orders create swings with no structural meaning. Most ICT traders anchor the count on the 4H or daily and execute lower.
Related query paths
Structure reading compounds quickly once the swing definitions and break rules are locked in. These are the logical next reads, in order.
- What Is a Swing High and Swing Low in ICT? The 3-Candle Rule — the exact pivot rule every count in this article depends on.
- What Is Market Structure in ICT? — the full structural framework that HH/HL sequences plug into.
- What is a Break of Structure (BOS)? — how continuation breaks confirm the trend leg by leg.
- Change of Character (CHoCH) Guide — the confirmation event when the last higher low finally breaks.
- Equal Highs & Equal Lows (EQH/EQL): Engineered Liquidity — what it means when the low series flattens instead of rising.
- ICT Top-Down Analysis: Multi-Timeframe Alignment — how to stack weekly and intraday structure counts without mixing them.
- What Is a Protected Swing High and Low in ICT? — how it connects to protected swing.