
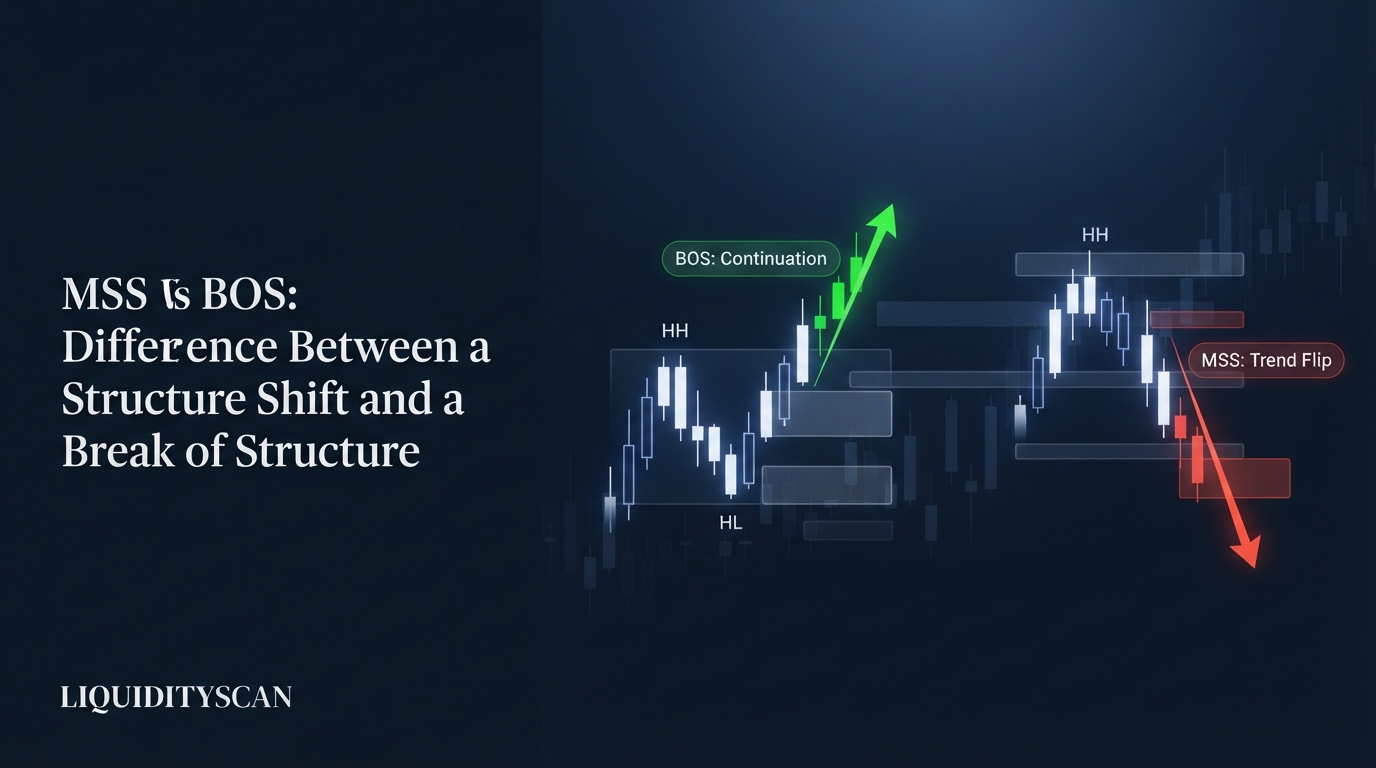
What Is the Difference Between MSS and BOS?
A Break of Structure (BOS) is a close beyond the most recent swing in the direction of the prevailing trend — it confirms the trend continues. A Market Structure Shift (MSS) is a break of the opposite-side swing, driven by displacement, that flips the trend. BOS = continuation; MSS = reversal.
They are the same kind of event — price closing through a prior structural swing — but they point in opposite directions and mean opposite things.
Reading MSS vs BOS correctly is the difference between adding to a trend and catching its turn. The trap is treating every structural break as bullish or bearish confirmation without asking which swing broke and where you sit in the trend.
What Is a Break of Structure (BOS)?
A break of structure is trend confirmation. In an uptrend, price makes higher highs and higher lows. When a candle closes above the most recent higher high, that is a bullish BOS: the trend just extended and the last higher low is now protected as a fresh structural reference.
The key attributes of a BOS:
- Direction: it always breaks with the trend — up-swing in an uptrend, down-swing in a downtrend.
- What it confirms: continuation. Buyers (or sellers) remain in control and the leg is still developing.
- Displacement: not required. A clean body close through the swing counts, even without an aggressive expansion candle. A slow grind that closes beyond the high is still a valid BOS.
- Reference swing: the most recent same-direction swing point, not an arbitrary level.
Example: BTCUSDT trends up, printing a higher high at 62,400 and a higher low at 60,900. A 1H candle closes at 62,650 — above 62,400. That close is a bullish BOS. The uptrend is intact and 60,900 becomes the low you defend.
Because a BOS only requires a close-through, confirmation should still be filtered — a wick above 62,400 that closes back below is not a BOS, just a raid on the highs.
A useful distinction: BOS confirms external structure — the swing highs and lows that define the trend on your working timeframe. It answers one question only: is the current leg still expanding in its established direction?
A run of BOS prints is the market telling you the draw on liquidity is unchanged, so with-trend setups keep the higher probability. That is why a BOS is a low-drama, high-frequency event: you will label several inside one healthy trend, and none of them alone implies a turn.
What Is a Market Structure Shift (MSS)?
A market structure shift is the first structurally significant break against the prevailing trend — and, critically, it is confirmed by Displacement: an aggressive, one-sided expansion candle (usually leaving a Fair Value Gap (FVG)) that closes decisively beyond the opposing swing. That energy is what separates a real trend flip from noise.
The key attributes of an MSS:
- Direction: it breaks against the current trend. In an uptrend, an MSS is a displaced close below the most recent higher low.
- What it confirms: the trend is changing. The path of least resistance — the Draw on Liquidity — has likely reversed.
- Displacement: required. Without a forceful, gap-leaving break, you have a weak counter-move, not a shift.
- Reference swing: the last protected swing on the opposite side of the trend.
Example: that same BTCUSDT uptrend stalls near 62,650, sweeps the highs, then a large bearish candle closes at 60,650 — below the 60,900 higher low — and leaves a bearish FVG on the way down.
That displaced break of the protected low is a bearish MSS. Structure has shifted from bullish to bearish, and the market is now a candidate for lower highs and lower lows.
Why displacement is non-negotiable: a protected higher low held every previous pullback in the trend. For price to close through it, the buyers who defended that level had to be overwhelmed. Overwhelm shows up as a wide-range, one-sided candle that outpaces normal delivery and prints an FVG — the mechanical fingerprint of aggressive, single-side order flow.
A slow, overlapping close below the same low means the level gave way without conviction, and those breaks fail far more often. The displacement filter is what keeps the MSS label honest.
One clarification traders ask for: an MSS is essentially a displacement-confirmed Change of Character (CHoCH) — the first opposite-side break becomes an MSS once displacement validates it, a distinction the dedicated CHoCH-vs-MSS guide covers in full. Here, the point is just that MSS pairs against BOS as reversal-versus-continuation.
MSS vs BOS: The Comparison Table
The two events share a mechanism but differ on every dimension that matters for a decision:
| Dimension | BOS (Break of Structure) | MSS (Market Structure Shift) |
|---|---|---|
| Direction vs trend | With the trend | Against / flips the trend |
| What it confirms | Trend continues | Trend is changing (reversal) |
| Displacement required | No — a clean body close is enough | Yes — aggressive expansion, usually an FVG |
| Swing that breaks | Most recent same-side swing (the last high in an uptrend) | Last protected opposite-side swing (the last higher low in an uptrend) |
| Where it appears | Throughout an established trend leg | At the end of a trend / start of the new one |
| How you trade it | Continuation entry on the retrace into the OB/FVG left by the break | Reversal entry on the retrace of the MSS impulse |
| Relation to CHoCH | Distinct — confirms, does not reverse | A displacement-confirmed CHoCH |
How to Trade BOS and MSS
Because they mean opposite things, they demand opposite playbooks. Both, though, are entered on the retrace — you never chase the break itself.
Trading a BOS (continuation)
A BOS leaves behind a discount pocket: the Order Block or FVG that produced the breaking move. In an uptrend, after a bullish BOS, mark the last down-close candle or gap beneath the broken high and wait for price to retrace into it.
That retracement is your continuation entry in the trend direction, with a stop below the protected structural low and a target at the next liquidity pool above.
Trading an MSS (reversal)
An MSS marks the birth of a new leg. Do not fade it and do not enter at the extreme. Instead, let price retrace into the FVG or order block created by the MSS impulse candle, then enter in the new direction.
After a bearish MSS, you short the pullback into the bearish FVG, stop above the swing that was swept before the shift, target the opposing liquidity that is now the draw. The MSS is your bias flip; the retrace is your entry.
Reliability differs, so should expectations
The two events do not carry the same base rate, and pretending they do costs money. A with-trend BOS entry works alongside momentum already in the market, so its retrace-continuation setups tend to resolve more consistently across regimes.
An MSS entry is a counter-trend bet on a turn — larger reward when right, cleaner invalidation, but it fails more often, because not every shift becomes a sustained new trend. Published SMC backtests scatter widely by instrument, session, and how strictly displacement is required, so treat any single win-rate figure with suspicion.
The honest move is to log every BOS and MSS you take with its context — timeframe, whether it swept liquidity first, whether displacement left an FVG — and read your own numbers rather than a borrowed one.
A Worked Example: Labeling BOS and MSS on One Sequence
Walk one EURUSD 15m sequence and label every event:
- Price rises, closing above a prior high at 1.0850 — BOS #1, uptrend confirmed. Protected low: 1.0820.
- Retrace holds 1.0820, then a close above 1.0880 — BOS #2. New protected low: 1.0862.
- Another leg up closes above 1.0905 — BOS #3. Trend is healthy; three same-side breaks in a row.
- Price stalls, wicks the highs to 1.0912 (sweeping buy-side liquidity), then a large bearish candle closes at 1.0845 — below the 1.0862 protected low — leaving a bearish FVG from 1.0895 to 1.0870. That displaced break is the MSS. Bias flips bearish.
- Price retraces up into the 1.0870–1.0895 FVG — the reversal entry — then rolls over and closes below 1.0845 again: BOS #4, now the first continuation break of the new downtrend.
Read the shape: BOS, BOS, BOS build the trend; one MSS flips it; then BOS, BOS extend the new direction. That rhythm — a run of with-trend breaks interrupted by a single displaced counter-break — is the signature you are labeling for.
Real MSS vs a Failed Liquidity Sweep, and Common Mistakes
The most expensive error is calling an MSS on a move that is really just a Liquidity Sweep that failed to flip. Above equal highs and prior swings, stops cluster; price often spikes through, grabs that liquidity, and snaps back. That wick is not a shift.
Use this filter to separate a real MSS from a failed sweep:
- Body close, not a wick. A real MSS closes beyond the structural swing. A sweep pierces with a wick and closes back inside the range.
- Displacement present. The break candle should be an expansion candle that leaves an FVG. No gap, no conviction — treat it as a raid, not a shift.
- Correct swing reference. The MSS must break the last protected opposite-side swing (the higher low that held the trend), not a minor internal pullback low.
The recurring mistakes traders make with MSS vs BOS:
- Calling every counter-move an MSS. A small pullback that dips below an internal low is often a normal retrace before the next BOS, not a reversal.
- Ignoring displacement. A slow, overlapping close below a low with no expansion is a weak signal; the trend frequently resumes.
- Wrong swing reference. Marking a BOS off a random high, or an MSS off an unprotected low, produces false signals in both directions.
- Fading the MSS instead of trading its retrace. The shift is the bias; the entry is the pullback into its FVG or order block.
Get the reference swing and the displacement filter right, and MSS vs BOS stops being ambiguous: a with-trend close-through is a break of structure that keeps you in the move, and a displaced counter-break of a protected swing is a market structure shift that turns you around.
Frequently Asked Questions
Is MSS the same as BOS?
No. A BOS breaks a swing in the direction of the existing trend and confirms it continues. An MSS breaks the opposite-side swing with displacement and signals the trend is reversing. They share the same mechanism — a close through a structural swing — but carry opposite meanings for bias and entry direction.
Does an MSS always require an FVG?
Not strictly, but displacement is required, and genuine displacement almost always leaves a Fair Value Gap. If the counter-trend break has no expansion candle and no gap, treat it as a weak signal or a possible failed sweep rather than a confirmed market structure shift.
Can a BOS become an MSS?
They are different events, but they chain: a run of BOS builds a trend, an MSS flips it, then the first with-trend break in the new direction is itself a BOS. So the break that follows an MSS is a BOS for the new trend — the MSS just reset which direction "with-trend" means.
How do I avoid confusing an MSS with a stop hunt?
Demand a body close beyond the last protected swing plus displacement leaving an FVG. A stop hunt or liquidity sweep spikes through with a wick and closes back inside the range. If the candle closes back inside, structure has not shifted — the sweep failed to flip the trend.
Related query paths
Follow the structure-reading journey from the base definitions into the reversal mechanics you will actually trade:
- What is a Break of Structure (BOS)? — nail the continuation-break definition before comparing it.
- Change of Character (CHoCH) Guide — the first opposite-side break that an MSS validates.
- CHoCH vs MSS: The Real Difference in ICT — where displacement turns a CHoCH into a confirmed shift.
- BOS vs. CHoCH: The Definitive Guide for SMC Traders — the sibling comparison that pairs continuation against the first reversal break.
- Displacement in ICT: Reading Institutional Intent — the force that separates a real MSS from a failed sweep.
- Liquidity Sweep Then MSS: Reversal Guide — the full stop-hunt-to-shift sequence in one playbook.
- How to Map Market Structure Top-Down: A Step-by-Step Method — a related angle on how to map market structure.