
ICT Structure vs Price Action Structure: What Actually Changed?
ICT kept classic price action's Dow-theory skeleton — higher highs and higher lows still define trend — but changed the causal model: structure breaks to collect liquidity, breaks require displacement to count, swings sit in a three-tier hierarchy, and timing decides whether any break is tradable.
That single paragraph hides a genuine philosophical split. Classic price action treats a structural break as the result of a shift in supply and demand. ICT treats many breaks as the purpose of the move itself: price is delivered through old highs and lows because resting stop orders sit there, and those orders are the fuel institutions need to fill size.
The consequence is not academic: the same candle sequence generates opposite trades under the two lenses. This comparison of ICT structure vs price action structure maps exactly where they diverge — and where they are secretly identical.
What Is Classic Price Action Structure?
Classic structure reading descends directly from Dow theory. An uptrend is a sequence of higher highs and higher lows; a downtrend is lower highs and lower lows. The trend is presumed intact until the sequence breaks — a lower low in an uptrend, a higher high in a downtrend.
Around that skeleton, the classic toolkit adds four layers:
- Horizontal support and resistance: zones where price reversed before are expected to attract buyers or sellers again.
- Trendlines and channels: diagonal structure connecting swing points; a trendline break warns of trend change.
- Chart patterns: head and shoulders, double tops, triangles, flags — recurring shapes read as consolidation or reversal.
- Volume as secondary confirmation: breaks on expanding volume are trusted more than quiet ones.
The causal story underneath is equilibrium economics. Support holds because buyers perceive value there. Resistance breaks because demand finally overwhelms supply, and price then "seeks a new equilibrium" — which is why the classic playbook says to buy breakouts and treat old resistance as new support. Every swing point carries roughly equal weight, and a break is typically confirmed by nothing more than a close beyond the level.
The Six Changes: How ICT Structure Departs From Classic Price Action
ICT market structure did not replace the Dow sequence. It changed six specific things inside it — five assumptions rewired, one deliberately kept.
1. Why structure breaks: liquidity engineering, not equilibrium
In the ICT model, old highs and lows are not walls of supply and demand — they are pools of resting orders. Stop-losses from shorts cluster just above prior highs; stops from longs cluster just below prior lows, alongside breakout entry orders pointing the same way.
The clustering itself is documented, not folklore: Carol Osler's Federal Reserve Bank of New York staff report on stop-loss orders and price cascades found that FX stop-loss orders cluster just beyond round numbers, and that triggering them can set off self-reinforcing price cascades. The same placement logic stacks stops beyond any obvious recent extreme — exactly where ICT points its analysis.
So where classic analysis says "resistance broke because demand won," ICT says price was often pushed through the level because the break itself supplies counterparties.
A fund that wants to sell size needs buyers; the densest population of forced and eager buyers lives just above the old high — breakout traders entering and shorts covering. Structure breaks to collect that buy-side liquidity, not merely because a trend exists. The old high stops being "resistance" and becomes a target, a Draw on Liquidity.
2. Failed breakout vs completed sweep: one event, opposite trades
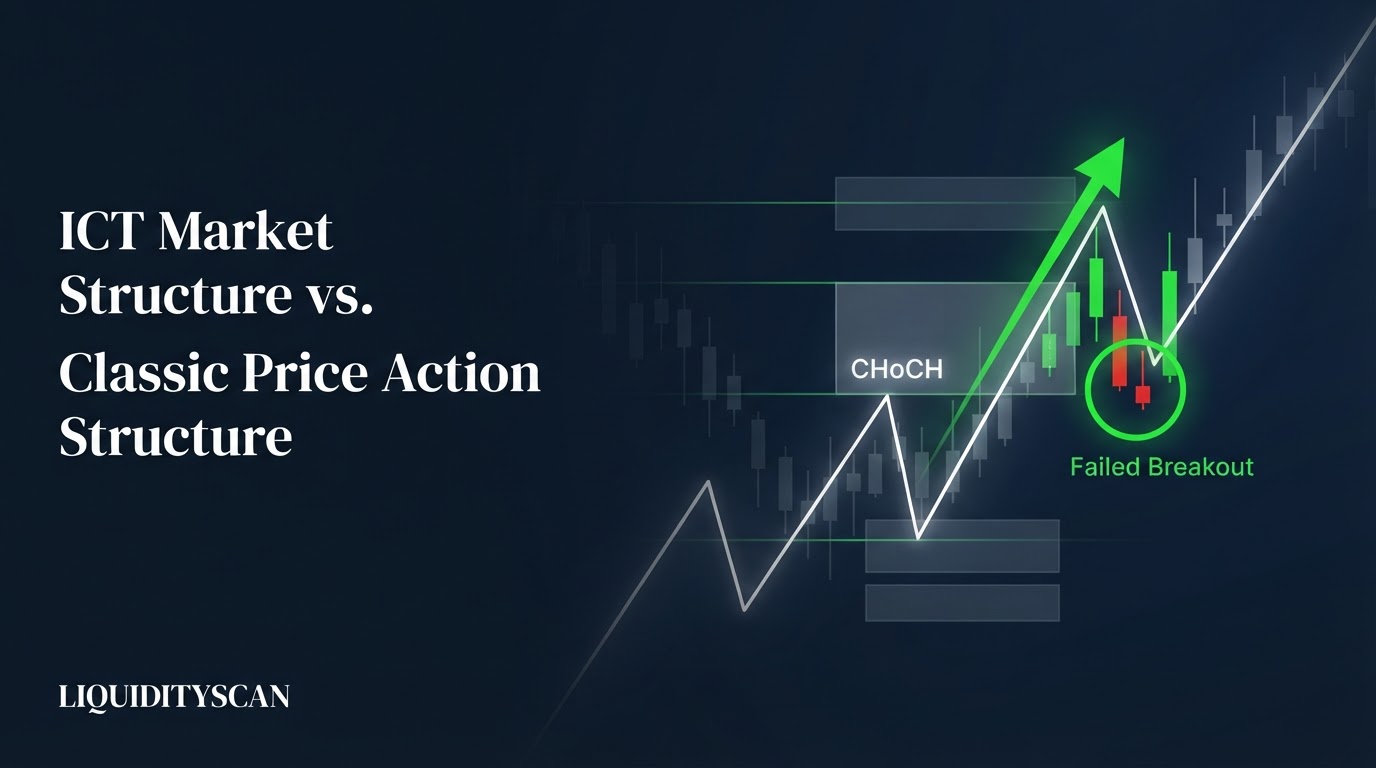
This is the sharpest single divergence. Price pushes above a prior high, stalls, and closes back below it.
- Classic read: a failed breakout, a bull trap. The pattern malfunctioned; the breakout trader is stopped out and moves on, or fades it reactively.
- ICT read: a liquidity sweep that completed exactly as designed. The run above the high was the trade's purpose — stops harvested, institutional sells filled — and the close back inside range is the confirmation that distribution happened.
Same candles, opposite interpretation, opposite position: the classic trader was long into the break and is now a casualty; the ICT trader was flat, waiting for precisely this sequence, and now hunts a short. Older schools knew the footprint — Wyckoff's upthrust, turtle soup — but ICT made the sweep the centerpiece of structural analysis rather than an exception to it.
3. Confirmation standards: any break vs close + displacement + FVG
Classic price action generally accepts any close beyond a swing as a structural break; stricter practitioners add a two-close rule or a percentage filter. ICT raises the bar with three stacked requirements before a move earns the label Break of Structure (BOS) or Change of Character (CHoCH):
- Body close beyond the swing — a wick through the level is a sweep, not a break.
- Displacement — the break must come from energetic, full-bodied expansion candles that signal institutional participation, not a drift over the line.
- An imbalance left behind — real displacement moves too fast for two-sided trade and prints a Fair Value Gap (FVG). No gap, no conviction.
The practical effect: a large share of events a classic trader logs as "structure broke" are reclassified by ICT as sweeps or noise. The framework deliberately trades fewer, cleaner structural signals in exchange for skipping ambiguous ones.
4. Swing hierarchy: STH/ITH/LTH vs flat swings
Classic analysis treats swing points on a chart as roughly interchangeable — a swing high is a swing high. ICT imposes a recursive three-tier hierarchy:
- Short-term high (STH): any high with a lower high on both sides.
- Intermediate-term high (ITH): an STH flanked by lower STHs on both sides.
- Long-term high (LTH): an ITH flanked by lower ITHs.
(Lows mirror the definitions.) The hierarchy is a built-in noise filter on a single timeframe: violating an STH is routine order flow; violating an ITH is a meaningful structural event; violating an LTH redefines the trend. Classic traders approximate this by switching timeframes — ICT encodes it into the swings themselves, so a 15-minute chart carries its own internal ranking of which breaks matter.
5. Structure plus time: the same break is not the same signal
Classic structure is time-agnostic — a breakout at 4:00 AM reads the same as one at 9:45 AM New York. ICT rejects that symmetry. Institutional execution concentrates in kill zones — London open (roughly 2:00–5:00 AM ET) and the New York AM session (roughly 8:30–11:00 AM ET) — around scheduled liquidity events.
A displacement break of an intermediate high inside the NY AM kill zone is a candidate signal. Geometrically identical candles during the New York lunch hour or the late-Asia drift are, in the ICT model, more likely engineered positioning for the next session than genuine intent. Time doesn't just filter signals; it inverts them — a dead-hours "breakout" is a warning of a sweep, not an invitation to chase.
6. What ICT kept from Dow theory
The skeleton is untouched. Trend is still a directional sequence of swings; a violated sequence still signals change; higher-timeframe trend still governs lower-timeframe reading, exactly as Dow's primary and secondary trends did. BOS is Dow's trend-continuation confirmation with stricter admission criteria; CHoCH is Dow's reversal warning with a displacement requirement bolted on. ICT renamed the joints and rewired the causality — it did not replace the anatomy.
ICT Structure vs Classic Price Action: Comparison Table
The two frameworks side by side:
| Dimension | Classic price action structure | ICT market structure |
|---|---|---|
| Why breaks happen | Supply/demand imbalance resolves; price seeks new equilibrium | Price is delivered through levels to collect resting stops and fill institutional size |
| Old highs/lows are | Support and resistance zones expected to hold | Liquidity pools expected to be raided (targets, not walls) |
| Failed breakout means | Pattern failure, a trap to avoid | A completed sweep — the setup itself |
| Break confirmation | Any close beyond the level (sometimes volume) | Body close + displacement + FVG left behind |
| Swing weighting | All swings roughly equal per timeframe | STH → ITH → LTH recursive hierarchy |
| Role of time | None — a break is a break at any hour | Central — kill-zone breaks are signal, dead-hour breaks are suspect |
| Standard entry | Buy the breakout or the retest of the broken level | Wait for the retrace into the break's origin (order block / FVG) in discount or premium |
| Stop placement | Beyond the nearest swing | Beyond the sweep extreme / invalidation of the liquidity thesis |
And the terminology map — most classic vocabulary has a direct ICT counterpart, which is the clearest evidence the two systems describe the same market:
| Classic term | Nearest ICT term | What shifted |
|---|---|---|
| Resistance | Buy-side liquidity (BSL) | From wall to target |
| Support | Sell-side liquidity (SSL) | From floor to target |
| Confirmed breakout | Break of Structure (BOS) | Displacement + FVG now required |
| Trend reversal / trendline break | Change of Character (CHoCH) / MSS | Anchored to swings, not diagonals |
| Bull/bear trap, upthrust, spring | Liquidity sweep, turtle soup, Judas swing | From anomaly to core mechanism |
| Double top / double bottom | Equal highs / equal lows (EQH/EQL) | From reversal pattern to engineered bait |
| Retest of broken level | Return to order block / FVG | Retest target is the break's origin, not the line |
| Trading range | Dealing range (premium/discount) | Range midpoint decides which side you trade |
One Chart, Two Readings: ICT Structure vs Price Action in Practice
EURUSD, 1-hour chart. Price has trended up from 1.0710: higher lows at 1.0735 and 1.0762, and two highs within a pip of each other at 1.0804 and 1.0805. At 9:30 AM New York, price rallies through 1.0805, prints a high at 1.0813, then closes the hour back at 1.0797. The next candle drives down through 1.0762 on a wide-bodied bar, leaving a gap between 1.0781 and 1.0774, and closes at 1.0758.
Classic reading: an uptrend with confirmed resistance at 1.0805. The push through it triggers breakout longs, stop below 1.0762. When the hour closes back inside, it's logged as a failed breakout; the break of 1.0762 then confirms a lower low. Verdict: trend damaged, longs stopped, wait for a base to form near 1.0710–1.0735 support before considering new longs. The event was a malfunction.
ICT reading: the equal highs at 1.0804/1.0805 were never resistance — they were engineered buy-side liquidity, and the wick to 1.0813 during the NY AM kill zone is a completed sweep. The displacement candle through the 1.0762 higher low, closing on its body and leaving a Fair Value Gap at 1.0774–1.0781, is a Change of Character. Verdict: bias flips bearish.
The trade is a short on the retrace into the FVG around 1.0778, stop above the 1.0813 sweep high, targeting the sell-side liquidity resting under 1.0710.
Both traders saw identical candles. One concluded "failed move, stand aside near support"; the other, "the move completed, sell the bounce." If price then drops to 1.0705, the ICT short banks roughly 2R — 73 pips of reward against a 35-pip stop — while the breakout long ate a stop. The frameworks are not cosmetically different; they route you into opposite positions.
Practical Consequences for Entries and Stops
The philosophical shift cashes out in three mechanical changes.
Entries: into the origin, not through the level. The classic playbook enters in the direction of the break, at or beyond the broken level — buying strength. ICT enters on the retrace into the break's origin: the last opposing candle before displacement (an Order Block) or the FVG the displacement left.
You are buying where the move started, at a discount, with a limit order — not chasing where it's already been. That structurally improves the risk-reward ratio, because your stop sits pips away instead of a full leg away.
Stops: beyond sweeps, not beyond swings. Classic logic parks stops just below the nearest swing low — which, in the ICT model, is exactly where the liquidity pool sits. Your stop is the pool. ICT places stops beyond the level whose violation kills the thesis: past the sweep extreme, past the order block's far edge — and treats a clean displacement through that point as genuine invalidation rather than bad luck.
Position in the range matters. Classic breakout buying routinely enters in the top of the recent range — premium pricing by definition. ICT's dealing-range discipline forbids longs above the range midpoint, forcing entries back into discount even after a bullish BOS. Fewer trades, later entries, better locations.
When Classic Structure Reading Still Wins
ICT structure vs price action is not a clean sweep for ICT. Classic reading remains superior in specific regimes:
- Genuine one-way trends. In a high-participation momentum trend — a post-CPI repricing, a strong index bull leg — breakouts follow through because real directional flow, not stop-hunting, is driving. The ICT trader waiting for a sweep-and-retrace sits in cash while the breakout trader compounds. Not every break is engineered; some markets are simply repricing.
- Simplicity and robustness. A Dow sequence plus honest S/R has two moving parts. Full ICT structure stacks five discretionary judgments (sweep? displacement? which swing tier? which session? which PD array?) — five places for hindsight bias to hide. For journaling and backtesting, the classic read is far easier to define objectively.
- Higher timeframes. On daily and weekly charts, where stop-hunt noise is small relative to swing size, plain HH/HL reading and classic breakout-retest behavior hold up well; the ICT refinements pay mostly on intraday execution.
An honest way to settle it on your own data: log every break of a meaningful swing for 60–90 days, tag displacement + FVG and kill-zone occurrence, then measure follow-through per bucket. Both camps tend to be right in their own regime — filtered breaks follow through at meaningfully higher rates intraday, while raw daily breaks in trends need no filter.
LiquidityScan automates exactly this tagging, flagging which structural breaks carried displacement and swept liquidity, so the regime question becomes measurable instead of tribal.
The verdict: combine them in layers, not in conflict. Use the Dow skeleton — the part both systems share — for directional bias on the higher timeframe. Then let ICT govern execution: demand displacement before trusting a break, treat swept highs and lows as fuel rather than failure, weight swings by hierarchy, and only act during hours when institutions actually transact.
In the ICT structure vs price action debate, the winning answer is that ICT is not a rival theory — it is a stricter, time-aware execution layer bolted onto the same hundred-year-old skeleton.
Frequently Asked Questions
Is ICT market structure just Dow theory rebranded?
Partly. The trend skeleton — higher highs and higher lows, sequence break signals change — is pure Dow. What's genuinely new is the causal layer: breaks explained by liquidity engineering, displacement and FVG confirmation requirements, the STH/ITH/LTH swing hierarchy, and time-of-day filters. Same anatomy, different physiology.
Can I use support and resistance together with ICT concepts?
Yes — but redefine their role. Keep drawing the same levels; stop expecting them to hold on first touch. Treat equal highs and clean S/R as magnets that price will likely raid before reversing, and plan entries on the reaction after the sweep rather than limit orders parked exactly at the level.
Which should a beginner learn first, classic price action or ICT?
Classic first. You cannot recognize what ICT changed without fluency in swings, trends, and S/R — every ICT concept is defined relative to that base. Spend a few months reading raw structure and marking levels, then layer in sweeps, displacement, and kill zones once plain breaks and retests feel automatic.
Do liquidity sweeps mean breakout trading never works?
No. Sweeps dominate range-bound and pre-session conditions, but genuine momentum breakouts follow through in strongly trending, high-participation markets. The skill is regime recognition: demand displacement and session timing before trusting an intraday break, and give clean higher-timeframe trend breaks more benefit of the doubt.
Related query paths
Build out the query network around structural analysis in this order — from definitions to confirmation mechanics to the wider framework comparison:
- What Is Market Structure in ICT? — the foundational definition behind every shift discussed here.
- What is a Break of Structure (BOS)? — the ICT version of the classic breakout, defined precisely.
- BOS vs. CHoCH: The Definitive Guide for SMC Traders — continuation vs reversal breaks, disambiguated.
- Liquidity Sweep Explained: The ICT Stop Hunt — the mechanism that turns a failed breakout into a setup.
- Valid vs Invalid BOS ICT: A 3-Factor Confirmation Guide — the close + displacement + FVG standard in checklist form.
- ICT vs Traditional Technical Analysis: A Trader's Guide — the same comparison widened beyond structure to the full toolkit.
- Is Market Structure Subjective? Removing Bias from Structure Reading — how it connects to is market structure subjective.
- Is ICT trading legit or hype? — Evaluate the evidence behind the structural concepts before relying on them.