
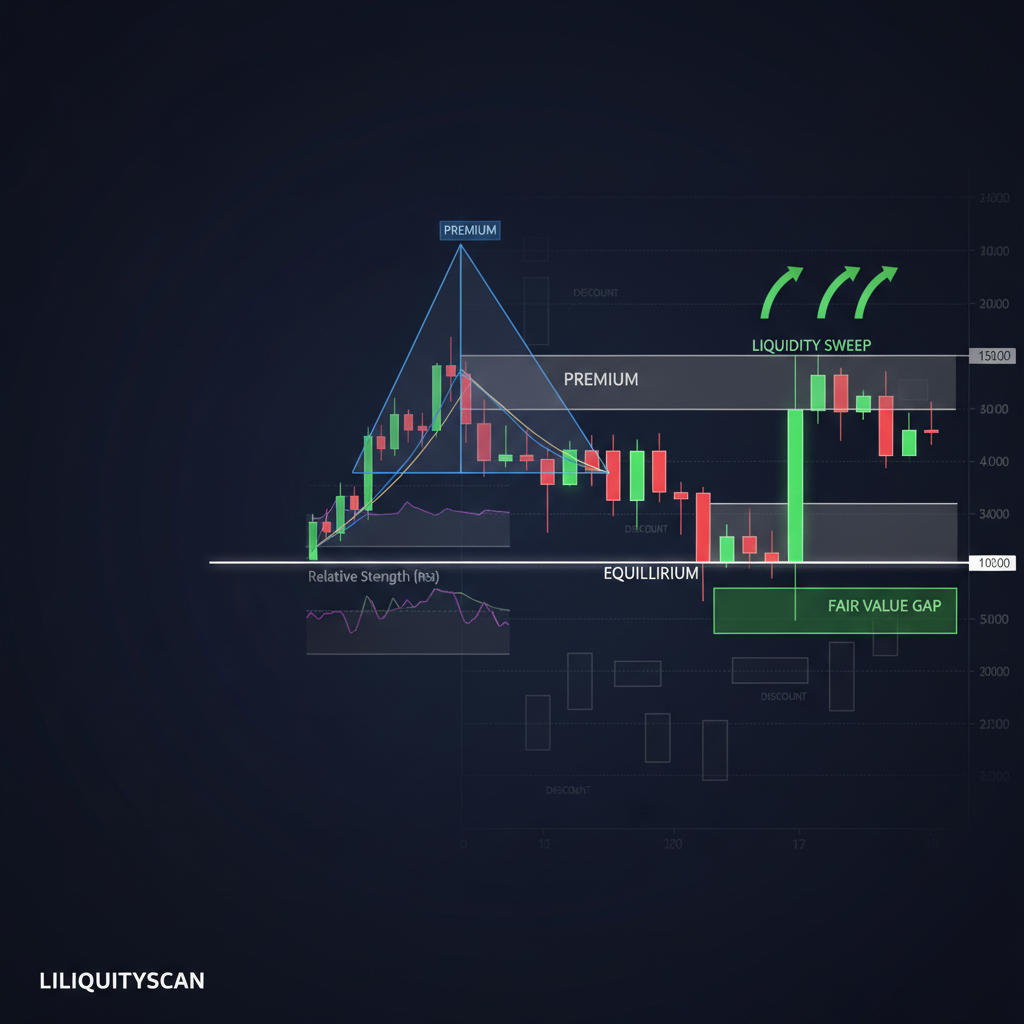
Traditional technical analysis reads price through indicators and repeating patterns — moving averages, RSI, MACD, head-and-shoulders, horizontal support and resistance. ICT reads the same chart through liquidity and algorithmic delivery: where stops sit, who gets trapped, and how price is engineered to reach one pool before reversing toward another. Both look at candles. They disagree on what a candle is telling you.
The practical difference is causal. Traditional TA asks what the pattern is. ICT asks why the level exists and what price is trying to reach. That single reframing changes which levels you trust and which you fade.
Where the two approaches actually overlap
They overlap more than tribal debates admit. Both are chart-based, both respect market structure, and both key off horizontal levels where price has reacted before. A traditional trader's "support" and an ICT trader's "sell-side liquidity" often mark the exact same price. The candles don't change; the label and the expectation do.
Support and resistance, trend, and prior swing points are shared vocabulary. Classic higher-highs-and-higher-lows trend structure maps cleanly onto ICT market structure. Round numbers, session highs, and obvious swing extremes matter to both camps — because both are ultimately watching the same crowd behavior, just from opposite sides of it.
Where ICT departs from traditional TA
ICT departs at the interpretation of a level, not the location of it. Where a traditional trader sees a double top as a reversal pattern to trade, an ICT trader sees two equal highs as a resting pool of buy-side liquidity — a target price is likely to run before reversing, not a wall it will politely respect.
That inversion repeats across the toolkit:
| Chart event | Traditional TA read | ICT read |
|---|---|---|
| Double top / equal highs | Reversal pattern; sell the level | Engineered liquidity; expect a sweep first |
| Break of support | Bearish breakout; go short | Possible stop hunt; watch for displacement back up |
| Gap in price | Gap to be filled, statistically | Fair value gap — an imbalance the algorithm revisits |
| Moving-average bounce | Dynamic support holding | Coincidence unless it aligns with a PD array |
| Oversold RSI | Buy signal | Irrelevant without a liquidity draw and time context |
The deeper split is lagging versus leading. Indicators are mathematical transforms of past price, so they confirm after the move. ICT tries to be leading by mapping the draw on liquidity — the objective price is being delivered toward — before the candle prints. You're not waiting for MACD to cross; you're anticipating which pool gets taken next.
Why the "why" behind a level matters more than the pattern
A pattern tells you what happened. A reason tells you what's likely next. Two identical double tops can resolve in opposite directions, and no amount of pattern-matching separates them — but the liquidity context does. Is this high sitting above an obvious pool of stops during a kill zone, with higher-timeframe bias pointing down? That's a different trade than the same shape printed midday against the trend with no liquidity overhead.
ICT also refuses to divorce price from time. Traditional TA mostly treats every hour as equal. ICT weights the session — London and New York kill zones, macro windows, the daily and weekly profile — because algorithmic delivery clusters into specific windows. A level that means nothing at noon can be the trade of the day at 9:50 a.m. That time filter is one of the sharpest edges ICT adds on top of the shared chart.
Which framework should you actually use?
Use the one whose questions match how you think, and borrow freely across the fence. ICT isn't a rejection of technical analysis — it's a re-interpretation of it built on liquidity and order flow. You can keep your structure reading and swing points and simply stop treating support as a wall and start treating it as a magnet for stops.
A practical hybrid most working traders land on:
- Keep from traditional TA: market structure, trend, horizontal levels, and the discipline of a defined pattern before you act.
- Add from ICT: liquidity mapping (where stops rest), displacement as proof of intent, fair value gaps and order blocks as entry zones, and time-of-day filtering.
- Drop the illusion: the belief that an oscillator "signal" is a reason. It's a description of the past, not a cause of the future.
The honest summary: traditional TA gives you a shared, testable vocabulary and clean rules. ICT gives you a causal story about who is on the other side of your trade. Neither is complete alone. The traders who compound tend to read the chart with TA's clarity and ICT's suspicion — always asking why a level is really there.
Frequently Asked Questions
Is ICT just rebranded support and resistance?
No. ICT often marks the same prices, but it flips the expectation: a level isn't a wall to hold, it's a pool of liquidity price is likely to sweep before reversing. Same location, opposite trade logic.
Do ICT traders use indicators at all?
Rarely as signals. Some use a moving average or session tool for context, but ICT treats indicators as lagging transforms of price rather than reasons to enter. The read comes from liquidity, structure, and time.
Can I combine ICT with classic technical analysis?
Yes, and most consistent traders do. Keep TA's structure and horizontal levels, then layer ICT's liquidity context and kill-zone timing on top. The two aren't rivals so much as different lenses on the same candles.
Related query paths
Once the framing clicks, these are the natural next reads to make it concrete.
- What Are Smart Money Concepts? A Trader's Guide to Order Flow — the foundation ICT builds on, in plain terms.
- ICT vs Supply and Demand: What's the Difference? — the other framework ICT is most often confused with.
- What Is a Liquidity Sweep? — the mechanic that replaces "support broke" in your reading.
- PD Array ICT Explained: A Trader's Guide to Premium & Discount — how ICT decides where a level actually sits on the range.
- Why ICT Setups Need Both Time and Price — the time filter that traditional TA leaves out.
- What Is the ICT Trading Strategy? A Methodology Guide
- ICT Books & Learning Resources: The Real Path
- Going Full-Time With ICT Trading: An Honest Roadmap