
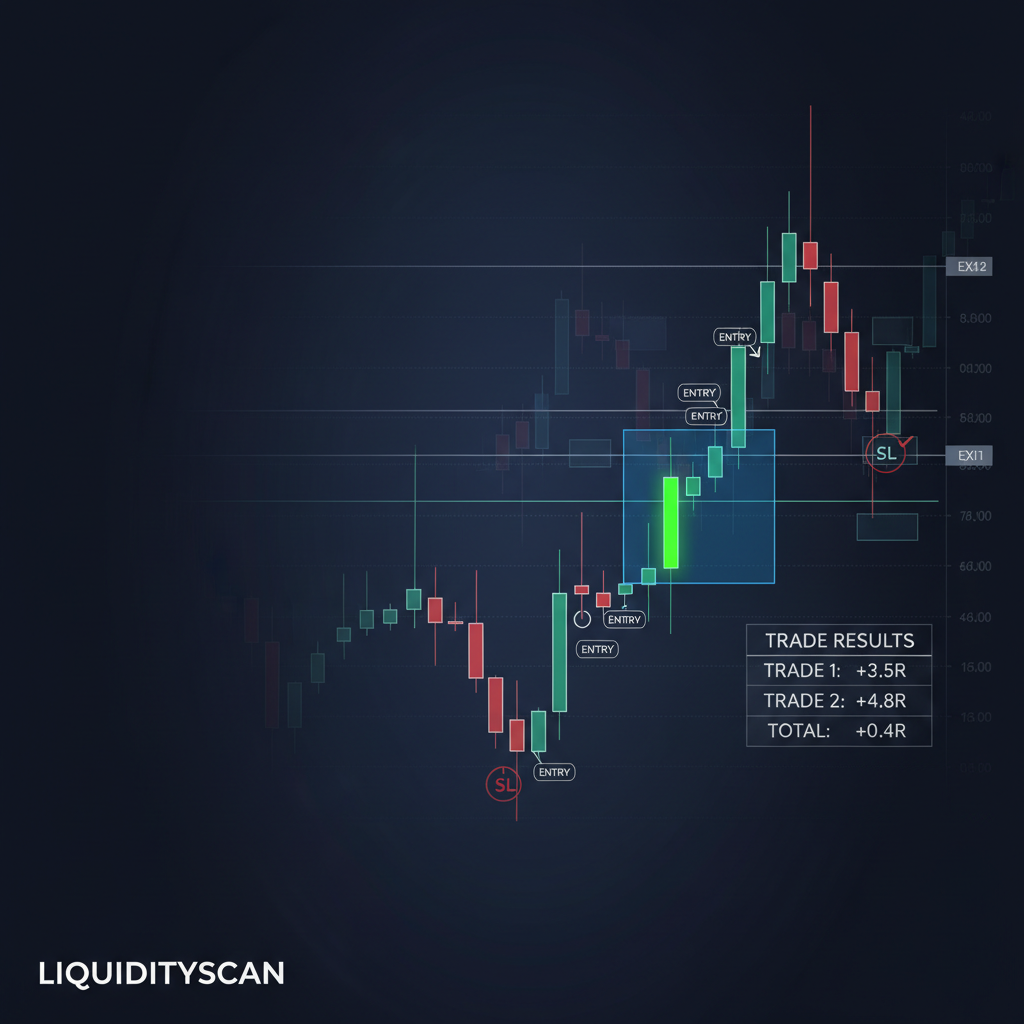
Why Backtest an ICT Strategy?
Most traders adopt an ICT concept because a chart looked clean in hindsight. That is not evidence. It is a memory of the times the setup worked, with the failures quietly forgotten.
Backtesting replaces that bias with a record. You define a setup, apply it across hundreds of past trades, and let the numbers tell you whether the edge is real or imagined.
An ICT strategy is only tradable if it survives measurement. Order blocks, fair value gaps, and liquidity sweeps all look powerful on a curated screenshot, but a backtest shows how they behave when you cannot cherry-pick.
Before you test anything, you should already have a narrow, specialized setup to test. Trying to validate ten concepts at once produces noise, not answers.
What to Actually Measure
A backtest that only tracks win rate is nearly useless. Win rate without reward tells you nothing about profitability. Four metrics matter, and they work together.
Win rate is the percentage of trades that hit target. A 40% win rate can be highly profitable if your winners are large relative to your losers.
Average R-multiple measures each trade in units of risk. If you risk 1R and make 2R, that trade is +2R. Logging in R normalizes across position sizes and instruments.
Expectancy is the number that decides everything. It is the average R you expect per trade: (win rate x average win in R) minus (loss rate x average loss in R). Positive expectancy means the strategy makes money over enough trades.
Sample size is your confidence multiplier. Twenty trades prove nothing. A hundred trades start to be meaningful, and several hundred across different market conditions are better still.
As Investopedia notes in its overview of backtesting, a strategy validated on too little data will not reliably repeat in live markets.
How to Backtest Step by Step
The process is simple to describe and demanding to execute honestly. Discipline is the whole game here.
1. Define mechanical rules. Write your setup so that two traders reading it would take the same trade. Specify the timeframe, the entry trigger, where stop-loss and target go, and every filter. If a rule contains the word "usually," it is not mechanical yet.
2. Pick a dataset. Choose a market and a range of history that includes trends, ranges, and volatility spikes. Testing only a bull run will flatter any long-biased ICT setup. Split your data so you can validate on periods you never optimized on.
3. Log every trade. Step through the chart bar by bar, and record each qualifying setup, win or lose, in R. Note entry, stop, target, outcome, session, and any context. The trades you are tempted to skip are exactly the ones that keep the sample honest.
This is where a structured journal earns its keep. A good template feeds the backtest directly, so the same records you keep live become your dataset over time.
When I run a fresh backtest with LiquidityScan on the chart, I still log by hand into a journal, because the act of writing each result forces me to be honest about what actually triggered.
Forward-Testing vs Backtesting
Backtesting looks backward at completed price history. Its strength is volume: you can gather hundreds of trades in an afternoon. Its weakness is hindsight, because you already know how each chart resolved.
Forward-testing runs the same mechanical rules on live or unseen data, in real time, with no knowledge of the outcome. It is slower but far more honest.
Use both in sequence. Backtest to build the sample and estimate expectancy, then forward-test to confirm the edge holds when you cannot see the future. If forward results collapse, your backtest was probably curve-fit.
Common Backtesting Pitfalls
Most backtests lie, and they lie in predictable ways. Knowing the traps is half the defense.
Curve-fitting is tuning rules until they fit past data perfectly. A setup with seven conditions that only worked on one instrument in one year is fit to noise. Fewer, simpler rules generalize better.
Hindsight bias creeps in when you mark entries knowing how the candle closed. Always decide the trade on the left side of the chart, before revealing what happened next.
Too-small samples let random luck masquerade as an edge. A 70% win rate over 15 trades can flip to 45% over 150. Do not commit capital until your sample is large enough to have lived through a losing streak.
Data-driven validation, done this way, is the difference between a strategy and a story. A worked example on order blocks shows how far honest numbers can differ from the popular narrative.
Frequently Asked Questions
How many trades do I need for a valid ICT backtest?
Aim for at least 100 trades, and prefer 200 or more spread across trending and ranging conditions. Small samples let luck imitate an edge, so more data means more confidence in your expectancy.
Is win rate the most important backtest metric?
No. Expectancy is. A 40% win rate with large winners often beats a 65% win rate with tiny ones. Always measure win rate together with average R-multiple.
Can I skip backtesting and just forward-test?
You can, but it is slow. Backtesting builds a large sample quickly, and forward-testing then confirms the edge on unseen data. Using both catches curve-fitting that either alone would miss.
Related query paths
Follow these to build the pieces that make a backtest meaningful.
- How to find your edge in ICT trading — specialize on one setup before you test it.
- The ICT trading journal template — the journal that feeds a backtest with clean data.
- Do order blocks still work? — a worked, data-driven example of the approach.
- FVG fill probability — see backtest statistics applied to real win rates.
- ICT Prop Firm Strategy: How to Pass the Challenge