▸ CATEGORY · RISK & STRATEGY
Risk & Strategy
Articles filed under "Risk & Strategy" — deep analysis from LiquidityScan Research.
What Is Curve Fitting (Overfitting) and How to Avoid It in Trading
Curve fitting is when you tune a strategy so tightly to historical data that it captures random noise instead of a real edge. It looks perfect in the backtest and falls apart live. Here is why it happens and how to build robust rules instead.
 Hayk Muradian·
·10 min
Hayk Muradian·
·10 min

FOMO in Trading: Why You Chase Entries and How to Beat It
FOMO in trading is the fear of missing out that pushes you to enter a trade late, at a worse price, outside your plan, because price is running without you. It quietly wrecks more good ICT traders than any bad setup.
Hayk Muradian·
·10 min
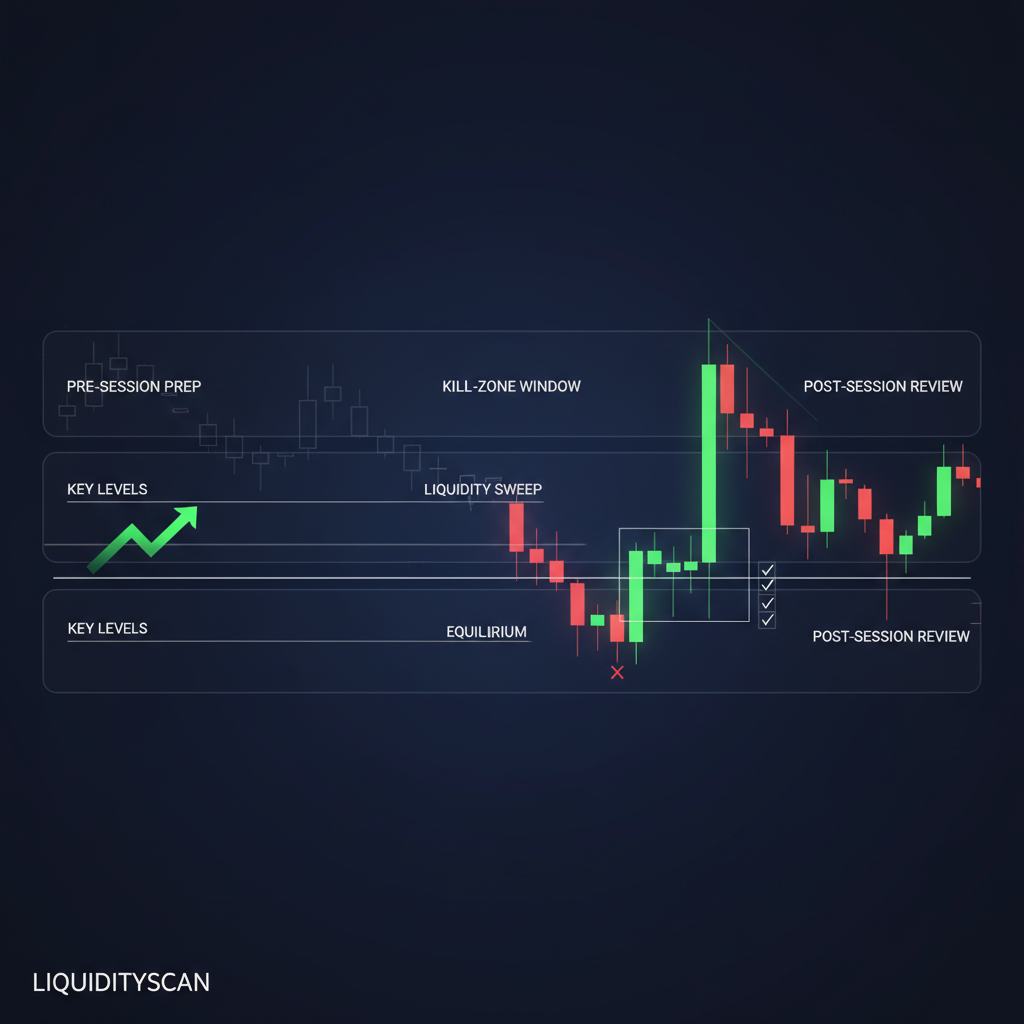
The Professional ICT Trading Routine: A Daily Playbook
Consistency in ICT comes from a repeatable routine, not a secret setup. Here is the daily loop professionals actually run.
Hayk Muradian·
·6 min

What a Profitable Trader Equity Curve Looks Like
A profitable equity curve stair-steps up through drawdowns and flat patches. Here's what a real ICT edge actually looks like on paper.
Hayk Muradian·
·6 min
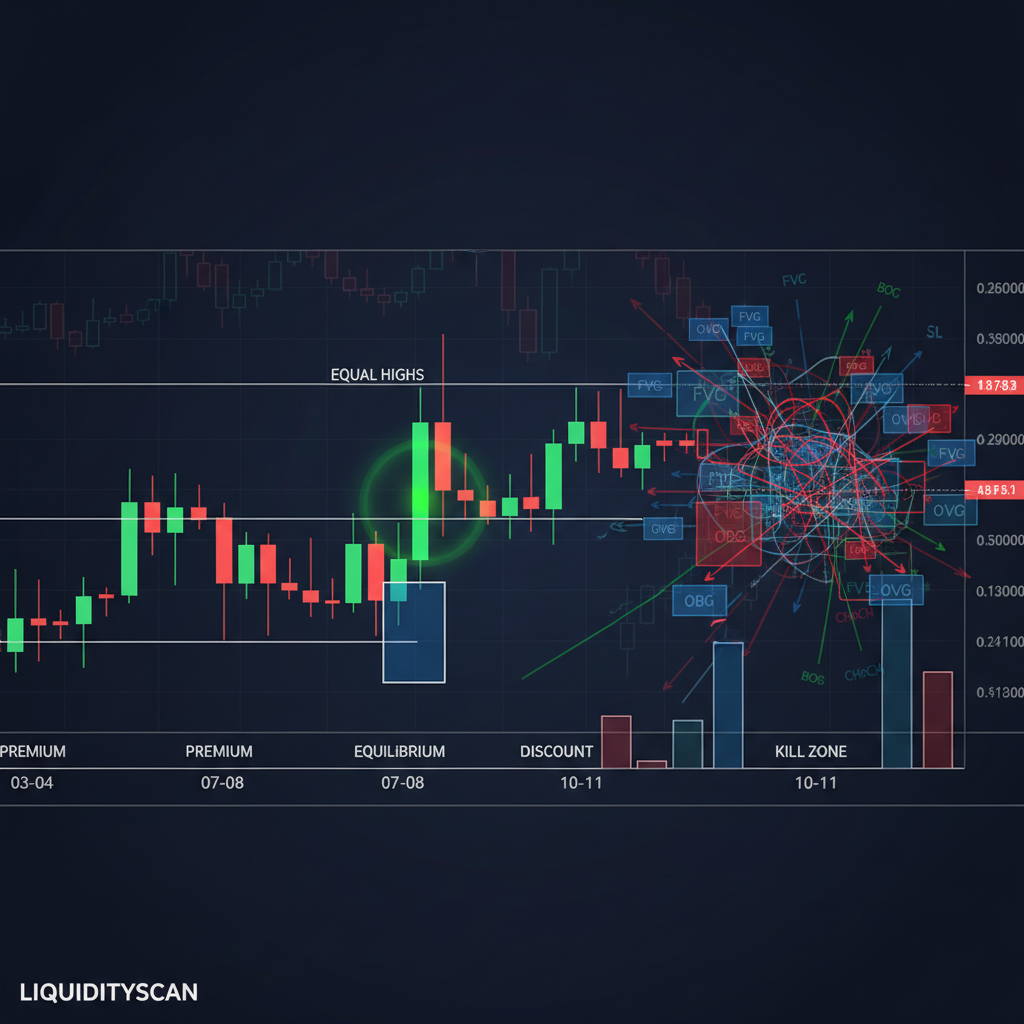
Why ICT Traders Fail: 5 Mistakes That Kill Accounts
Most ICT traders fail for the same five reasons. Here's each failure mode paired with the fix that actually moves your equity curve.
Hayk Muradian·
·6 min
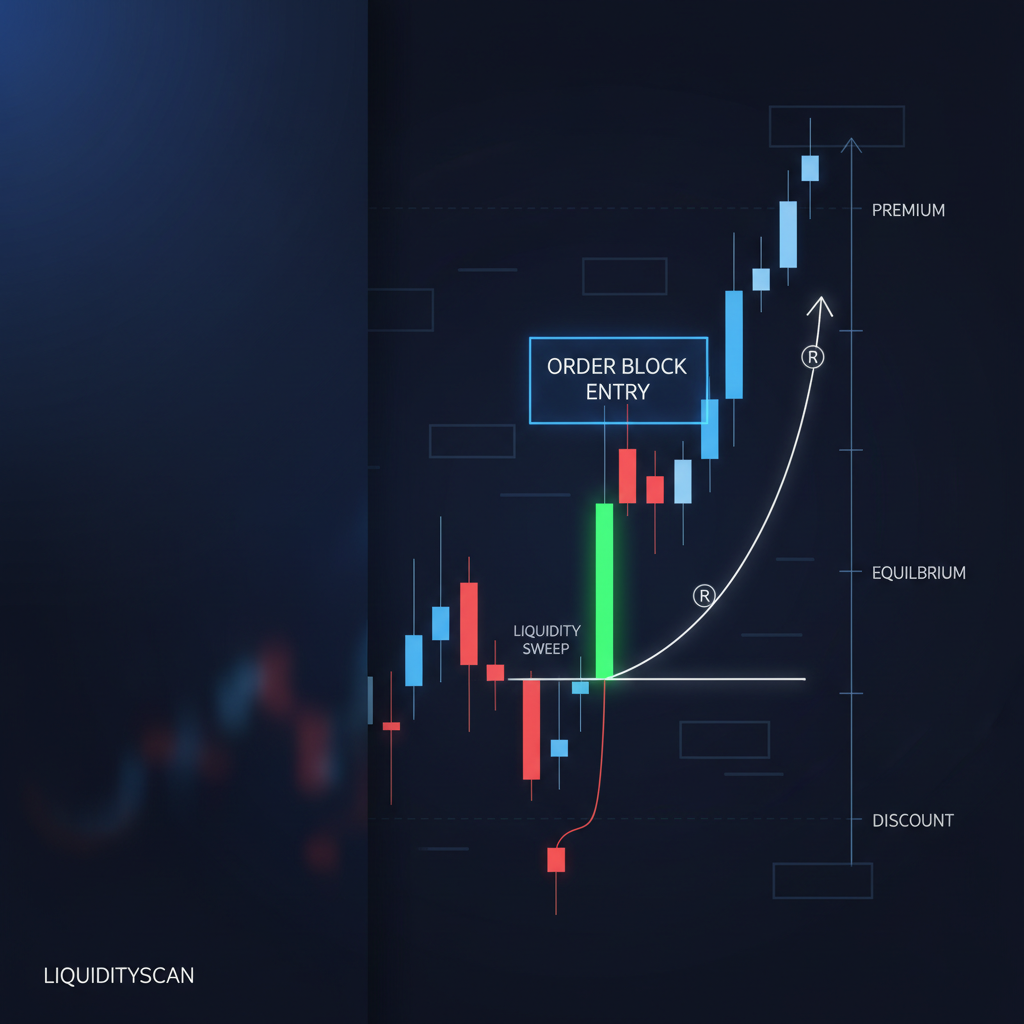
Going Full-Time With ICT Trading: An Honest Roadmap
Going full-time with ICT trading is a math and evidence problem, not a motivation problem. Here are the milestones that actually gate the decision.
Hayk Muradian·
·6 min
The ICT 3-6-9 Theory Explained: A Consistency Framework
The ICT 3-6-9 theory isn't numerology. It's a discipline for compounding a small, repeatable edge over defined intervals of trades.
Hayk Muradian·
·5 min
ICT Prop Firm Strategy: How to Pass the Challenge
Passing a prop challenge with ICT is a rules problem, not a setup problem. Match your model to the firm's drawdown math and trade less.
Hayk Muradian·
·6 min

Stop-Loss Hunting Explained: Is It Real and How to Avoid Getting Swept
Yes, stop-loss hunting is real, but not because anyone is watching your order. Price gravitates to where stops cluster because large orders need that resting liquidity to fill. Here is how to place stops that survive.
Hayk Muradian·
·10 min
How Many Losses in a Row Is Normal? Losing-Streak Probability Explained
Long losing streaks are not a broken edge — they are guaranteed by probability. A 50%-win system over 200 trades will likely hit a 7-plus streak; a 40%-win system should expect 10. Here is the math, and how to survive it.
Hayk Muradian·
·11 min

Risk-to-Reward vs Win Rate: Which Matters More for Profitability?
Win rate vs risk reward is a false choice. They multiply into one number, expectancy, and profitability lives there. But for most retail traders, raising average R is easier and more robust than lifting win rate.
Hayk Muradian·
·10 min
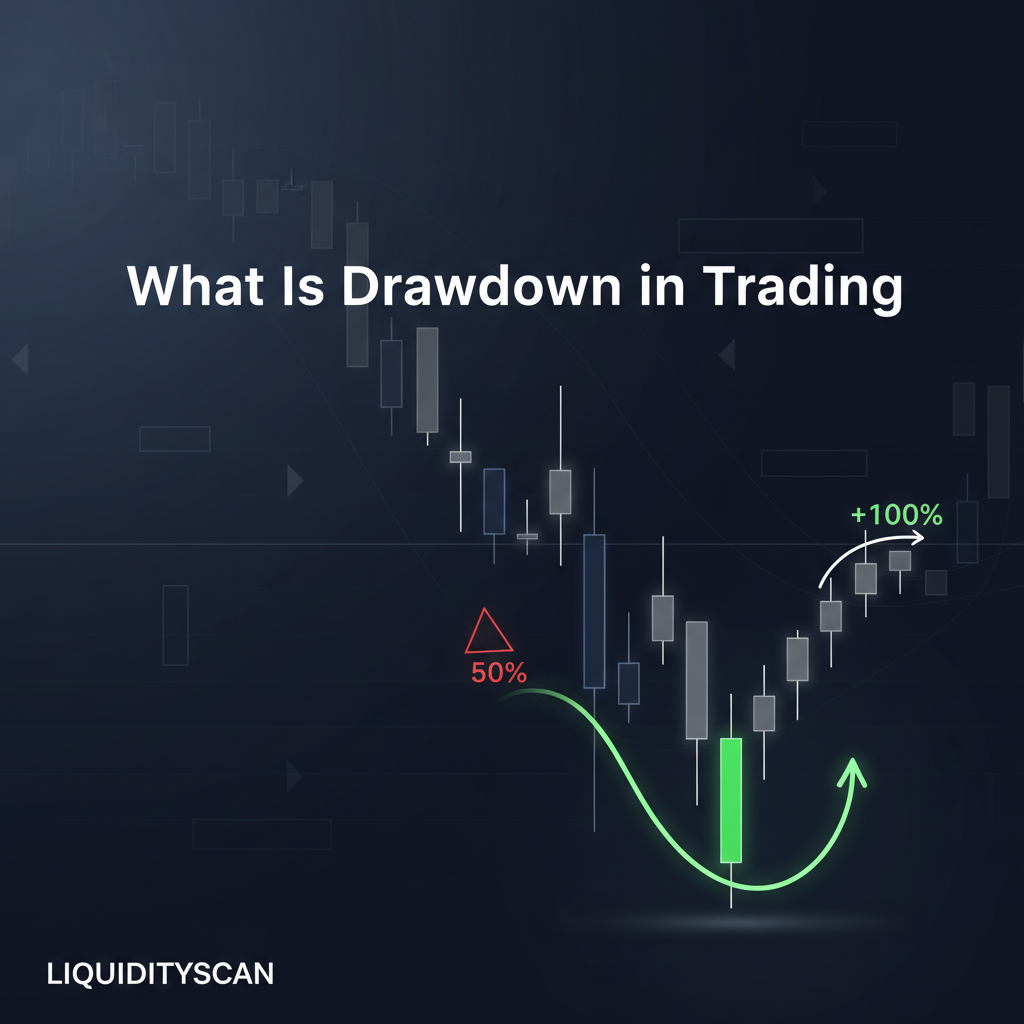
What Is Drawdown in Trading and How to Recover From It
Drawdown is the peak-to-trough decline in your account equity, measured as a percentage. The deeper it gets, the more asymmetric the recovery: a 50% drawdown needs a 100% gain just to break even.
Hayk Muradian·
·10 min
What Is Trading Expectancy and How Do You Calculate It?
Trading expectancy is the average amount you can expect to win or lose per trade over a large sample. Positive expectancy means an edge; win rate alone tells you almost nothing.
Hayk Muradian·
·10 min
What Is a Good Risk-to-Reward Ratio for ICT Trades?
There is no universal "good" risk-to-reward ratio. What matters is pairing R:R with your real win rate to get positive expectancy. ICT setups typically aim 1:2 to 1:5 because structural stops make asymmetric payoffs possible.
Hayk Muradian·
·10 min

Trading Psychology for ICT Traders: Mastering Discipline and Emotion
Two traders run the identical ICT model and get opposite results. The difference is not the setup; it is execution under emotion. Trading psychology is the edge that survives drawdown.
Hayk Muradian·
·10 min
How Much Should You Risk Per Trade? The 1% and 2% Rule Explained
Most professional traders risk 0.5-2% of account equity per trade, and 1% is the common default because it lets you survive a long losing streak intact. Here is the survival math behind that number and how to set your own.
Hayk Muradian·
·10 min
How to Calculate Position Size for an ICT Trade (Step-by-Step)
Position size = (account x risk%) divided by stop distance. Fix your dollar risk, measure the distance from entry to your structural invalidation, then divide. The stop sets the size, not leverage.
Hayk Muradian·
·10 min
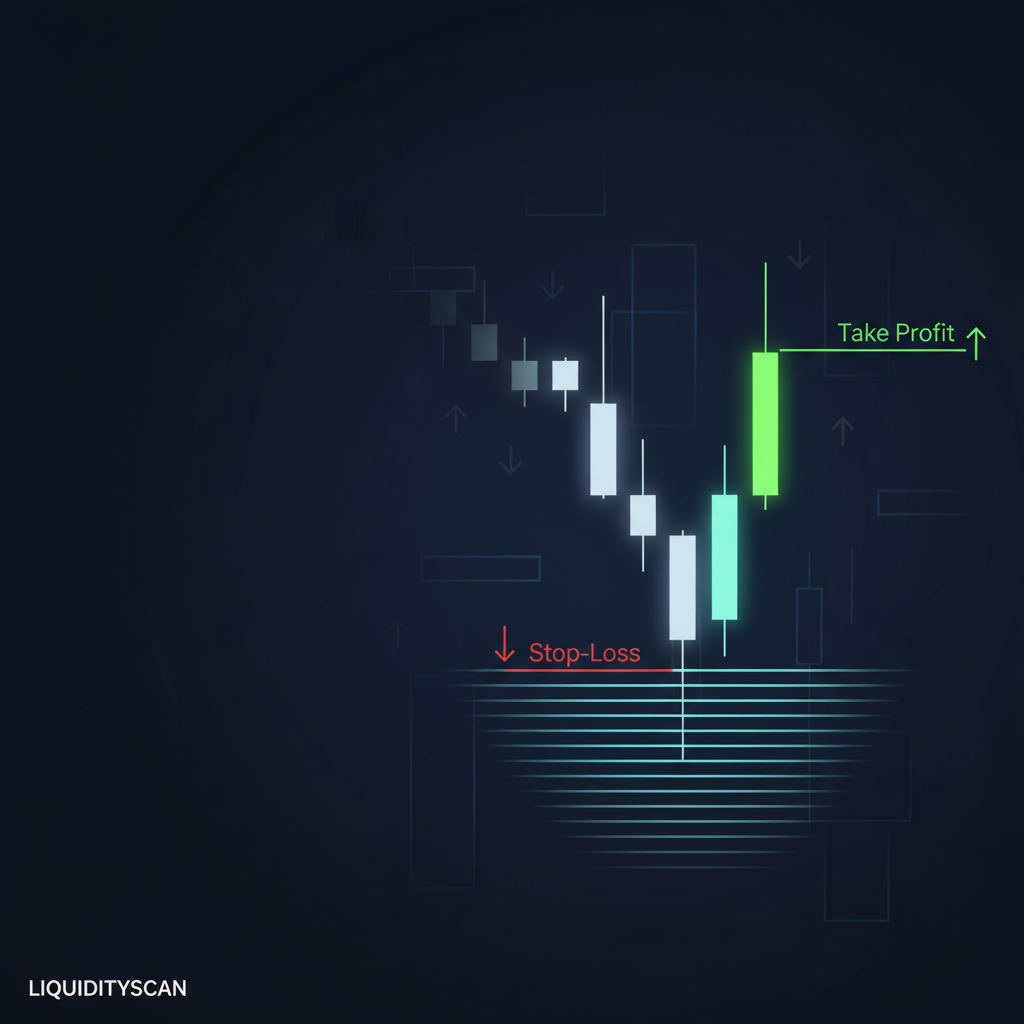
ICT Position Sizing: Stop Guessing Your Trade Size
ICT position sizing turns risk into a fixed input. Risk one percent, think in R-multiples, and let tight liquidity-based stops size the trade for you.
Hayk Muradian·
·4 min
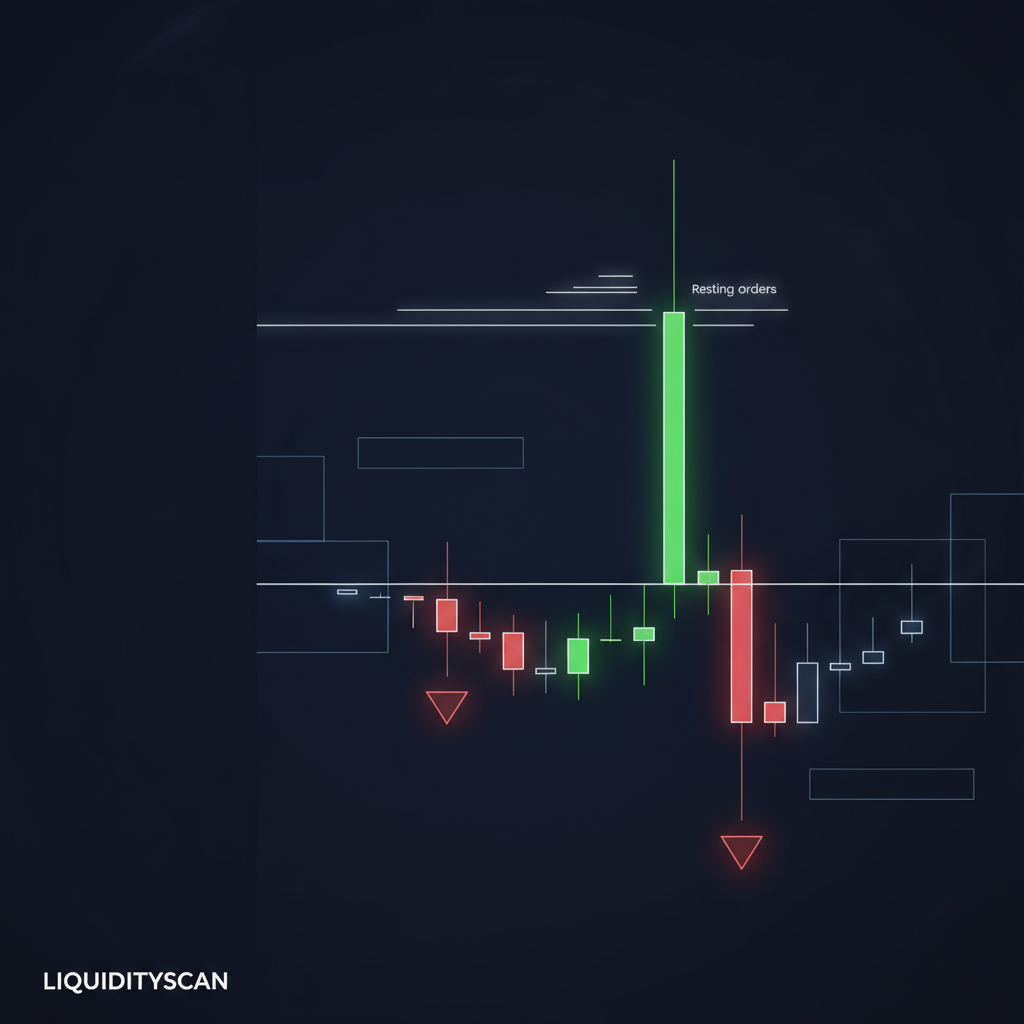
ICT News Trading: Discipline Around High-Impact Events
ICT news trading isn't about predicting the number. It's about letting NFP, FOMC and CPI run stops first, then reacting to structure.
Hayk Muradian·
·4 min
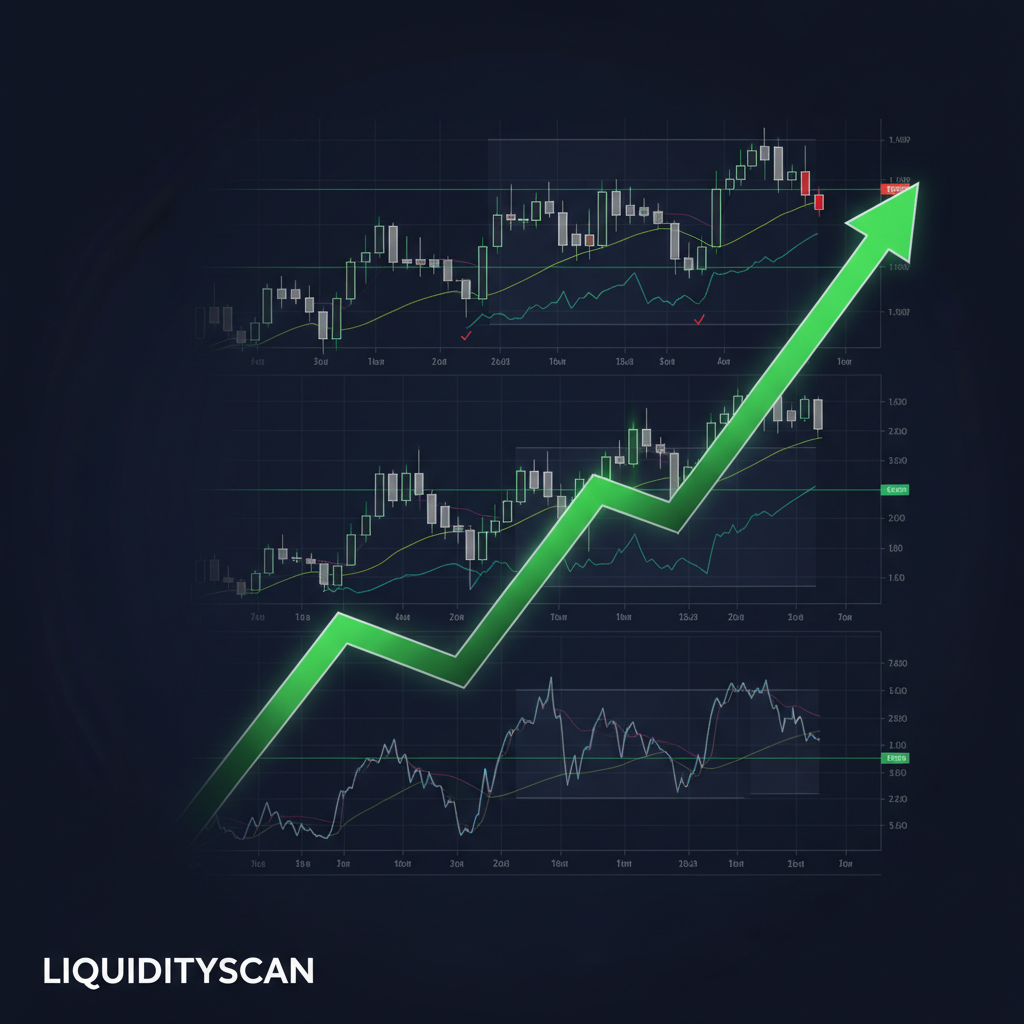
ICT Top-Down Analysis: Stop Fighting the Chart
ICT top-down analysis stacks timeframes so higher-timeframe bias, intermediate liquidity, and a refined lower-timeframe entry all point the same way.
Hayk Muradian·
·5 min
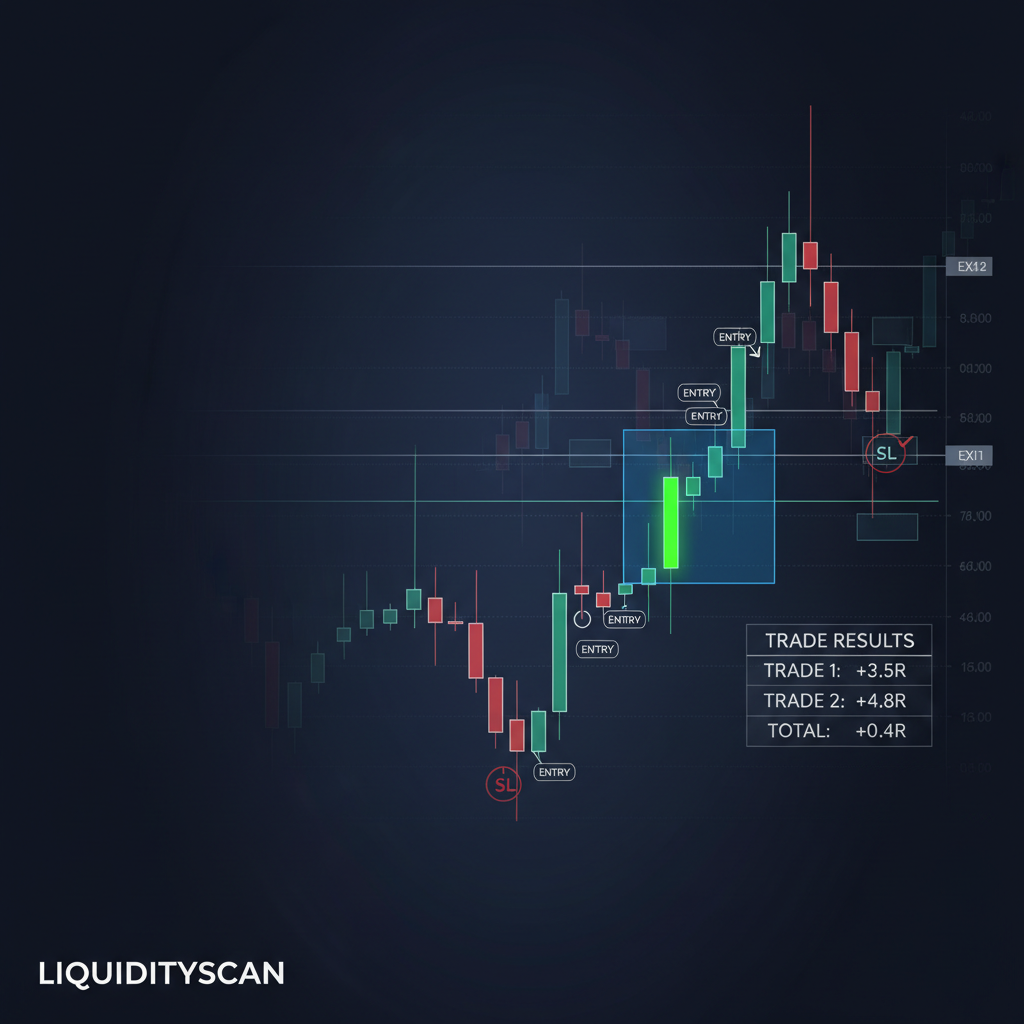
Backtest Your ICT Strategy Before It Costs You
A proper backtest turns "this setup feels good" into numbers you can trust. Here is how to backtest an ICT strategy without fooling yourself.
Hayk Muradian·
·5 min
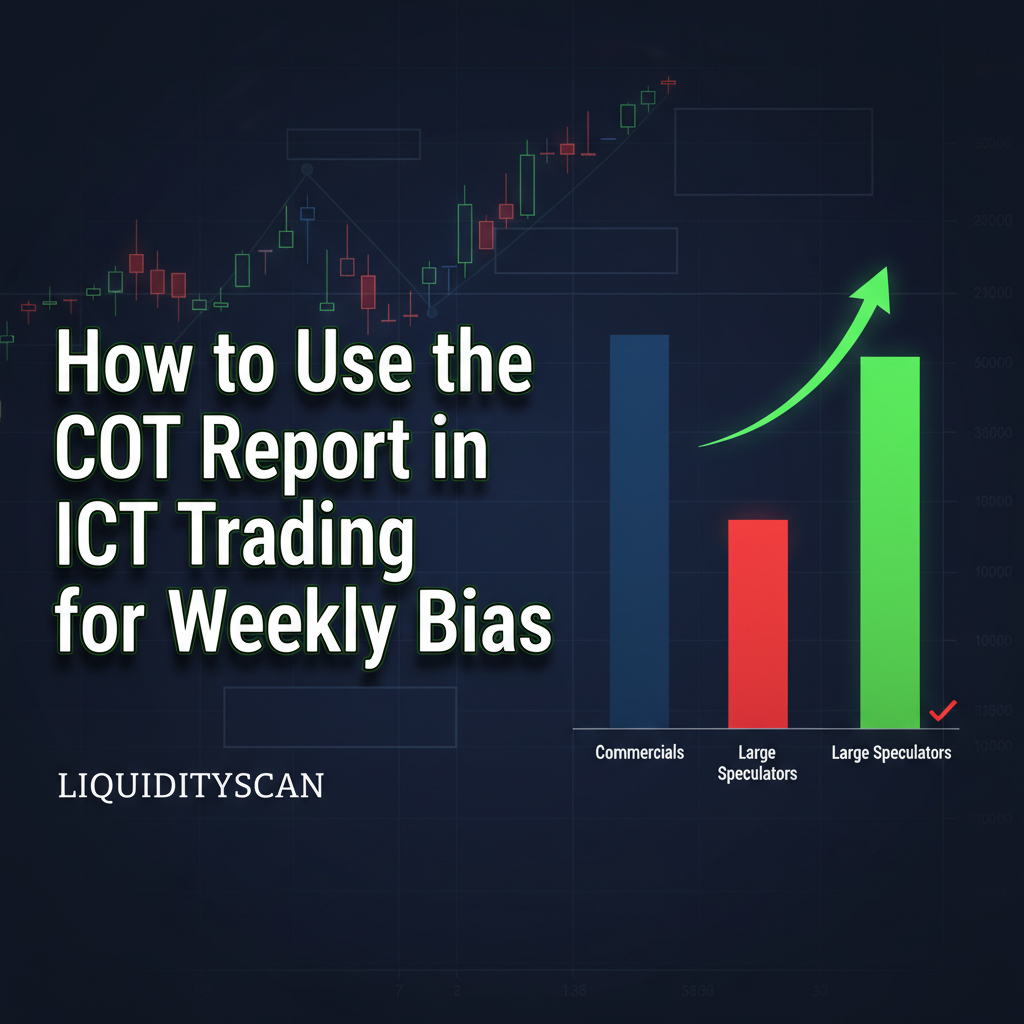
How to Use the COT Report in ICT Trading for Weekly Bias
ICT traders use the Commitment of Traders (COT) report to establish a high-timeframe weekly bias by analyzing the net positions of Commercials and Large Speculators, aligning this institutional sentiment with prevailing market structure to anticipate the week's likely expansion direction.
Hayk Muradian·
·8 min
5 Common Risk Management Mistakes That Invalidate ICT Strategies
Your ICT analysis can be flawless and still lose money. These five risk management mistakes break the logic of valid setups before the move even starts.
Hayk Muradian·
·7 min

How to Build a Complete ICT Trading Model (Step-by-Step)
A step-by-step framework for turning ICT concepts into one repeatable, backtestable trading model — bias, liquidity, entry, risk, and review.
Hayk Muradian·
·8 min
How to Use CFTC Data to Establish a Weekly ICT Bias
A step-by-step guide to turning the weekly CFTC Commitment of Traders report into a directional ICT bias — and why you still need a real-time read of order flow.
Hayk Muradian·
·6 min
ICT Risk Management Framework
A multi-layered, institutional-grade system for capital preservation in ICT and SMC trading, from per-trade risk to weekly account exposure.
Hayk Muradian·
·5 min

Daily/Weekly Bias Determination & Trade Journaling
Treat bias as a testable hypothesis, not a one-time prediction. Here is a repeatable framework to determine your daily and weekly ICT bias — and journal it so the market corrects you.
Hayk Muradian·
·6 min
The ICT Trading Journal Template Pros Use to Build Edge
The ICT Trading Journal Template Pros Use to Build Edge
Hayk Muradian·
·6 min

A Practical ICT Trading Model for Part-Time Traders
A Practical ICT Trading Model for Part-Time Traders
Hayk Muradian·
·6 min
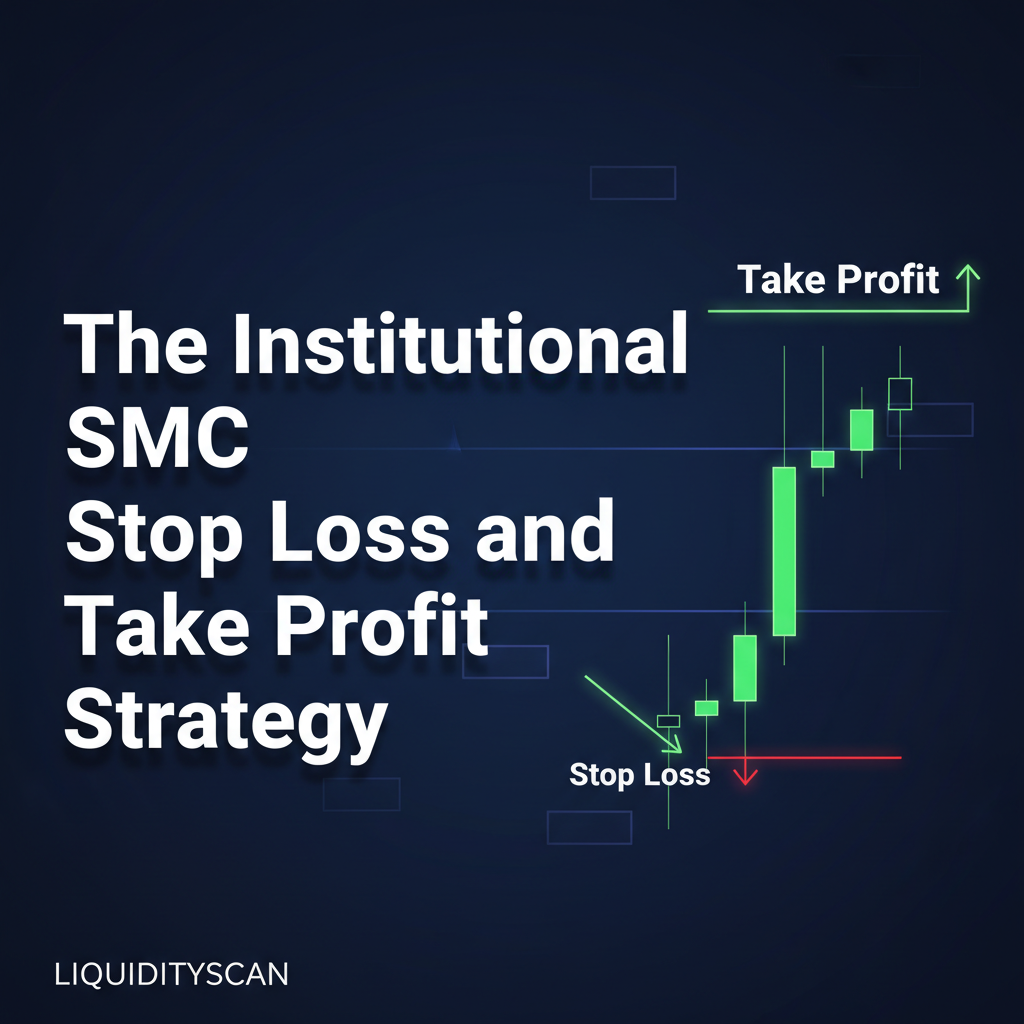
The Institutional SMC Stop Loss and Take Profit Strategy
The Institutional SMC Stop Loss and Take Profit Strategy
Hayk Muradian·
·6 min
How to Find Your Edge in ICT Trading: A Framework for Specialization
How to Find Your Edge in ICT Trading: A Framework for Specialization
Hayk Muradian·
·7 min
Not trading advice. LiquidityScan publishes educational content for informational purposes only. Trading involves substantial risk of loss.