
What Is a Good Risk-to-Reward Ratio for ICT Trades?
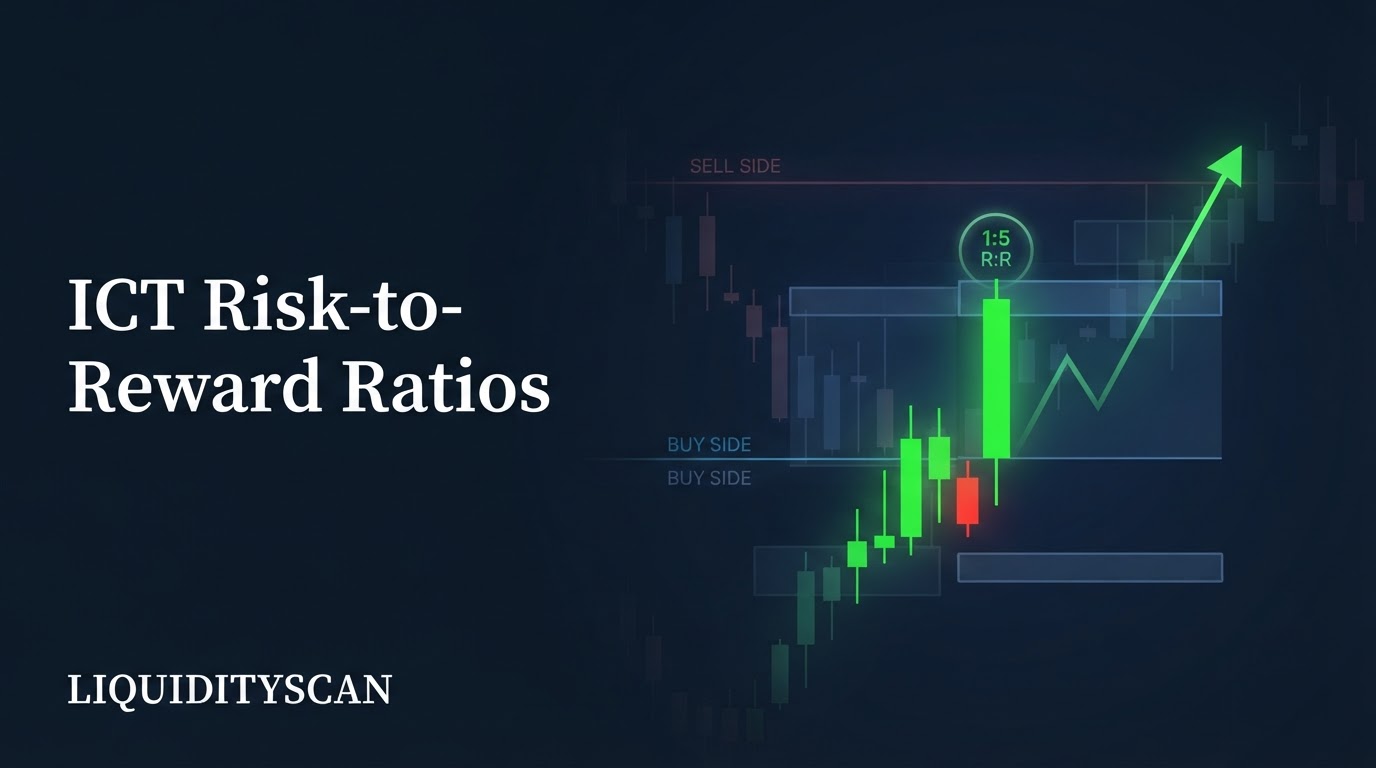
There is no single good risk reward ratio in ICT. What actually matters is your R:R paired with your win rate, because together they decide expectancy. Most ICT setups target between 1:2 and 1:5 because structural stops make asymmetric payoffs realistic.
A 1:5 trade is only "good" if your setup hits often enough to clear its breakeven win rate. Otherwise a lower-R, higher-hit-rate approach makes more money. The number on its own tells you nothing. The ratio is one half of an equation, and traders who fixate on it in isolation usually pick a target that quietly loses.
ICT gives you an edge here because Order Block and Liquidity Sweep entries produce tight, logical stops. That structure lets you build high R:R without widening risk. But the ceiling on your R is set by your setup's real hit rate, which you have to measure, not assume.
How to Calculate the Risk-to-Reward Ratio
Risk-to-reward is a distance ratio, not a probability. You compute it directly off your three price levels: entry, stop-loss, and target.
- Risk distance = |entry price − stop-loss price|
- Reward distance = |target price − entry price|
- R:R = reward distance ÷ risk distance, expressed as 1:R
Say you buy a bullish Order Block on BTCUSDT at 60,000, place your stop at 59,600 (below the sweep low), and target the opposing liquidity pool at 61,200. Risk is 400 points, reward is 1,200 points, so R = 1,200 ÷ 400 = 3. That is a 1:3 setup, or "3R" of potential.
Expressing outcomes in R rather than dollars is the point. If you risk a fixed 1% of account per trade, then "1R" is 1% and a 1:3 winner is +3%. This normalizes every trade regardless of instrument or position size, which is exactly what makes ICT position sizing and journaling comparable across pairs.
One caution on the arithmetic: measure risk to your actual stop, not to a round number you wish you had used. Traders inflate their reported R:R by quoting a tighter stop than the one their setup really requires, then get stopped in real trading at the wider level.
The ratio you log is only honest if the stop distance is the level that genuinely invalidates the idea — beyond the sweep, beyond the order block, wick included.
Why Risk-to-Reward Is Meaningless Without Win Rate
A risk reward ratio only becomes useful when you attach it to a win rate, because the pair determines expectancy. Expectancy per trade, in R, is:
Expectancy = (Win% × R) − (Loss% × 1)
The breakeven win rate for any R is 1 ÷ (1 + R). Beat it and you are profitable; fall below it and no ratio saves you. Here is the table every ICT trader should have memorized:
| Target R:R | Breakeven win rate | Win rate needed to profit |
|---|---|---|
| 1:1 | 50.0% | > 50% |
| 1:1.5 | 40.0% | > 40% |
| 1:2 | 33.3% | > 33% |
| 1:3 | 25.0% | > 25% |
| 1:4 | 20.0% | > 20% |
| 1:5 | 16.7% | > 17% |
| 1:10 | 9.1% | > 9% |
Read it both ways. At 1:2 you only need to be right one time in three to break even. But at 1:5 you need to be right barely one in six — which sounds easy until you realize the more distant your target, the fewer trades reach it.
The breakeven bar drops, but so does your actual hit rate. That tension is the whole game.
Why ICT Structure Naturally Produces High Risk-to-Reward
ICT setups tend toward high R:R for a structural reason: the stop and the target are both anchored to liquidity, and those anchors are usually far apart relative to the entry precision.
Your stop sits just beyond the invalidation point — below the low that swept Sell-Side Liquidity, or above the high of a bearish Order Block. Because a valid setup requires that level to hold, you can place a tight stop honestly rather than arbitrarily.
Meanwhile your target is the opposing pool that price is reaching for — the Draw on Liquidity. That distance is dictated by market structure, not by a fixed pip goal.
The result is asymmetry by construction:
- Tight structural stop — entry at a refined Fair Value Gap (FVG) or order block edge keeps risk distance small.
- Distant liquidity target — equal highs, an old daily high, or an unfilled gap sit far from a discount entry.
- Displacement confirms intent — a strong Displacement leg suggests price will travel, supporting the larger reward leg.
This is why ICT traders can quote 1:3 or 1:5 as normal. The method is built to enter near invalidation and exit near the next liquidity objective. Retail stop-and-target placement rarely gets that geometry.
Contrast that with a support-and-resistance trader who buys a level and sets a target at the next resistance a similar distance away — a structural 1:1.
The ICT edge is not that price behaves differently for you; it is that entering at a refined discount point next to invalidation compresses the risk leg while the reward leg stays tied to a distant, real liquidity draw.
Refining the entry from a raw 4H order block down to a 5m order block inside it is the single lever that most improves R without touching the target.
Realistic ICT Risk-Reward by Setup Type
The right R:R target is not one number — it scales with the timeframe and the nature of the setup. Faster, smaller setups hit more often but travel less; higher-timeframe swings travel further but resolve less often.
| Setup type | Typical entry TF | Realistic R:R aim | Hit-rate profile |
|---|---|---|---|
| Kill-zone scalp (Silver Bullet, sweep reclaim) | 1m–5m | 1:2 to 1:3 | Higher hit rate, quick resolution |
| Intraday model (session bias to LTF entry) | 15m | 1:3 to 1:4 | Moderate hit rate |
| Swing (HTF order block, weekly draw) | 4H–Daily | 1:4 to 1:5+ | Lower hit rate, larger travel |
These are ranges to anchor expectations, not promises. The point is directional: a scalp that targets 1:5 usually overshoots the intraday liquidity available before the next session shift, so it stalls and reverses.
A swing that settles for 1:1.5 wastes the structural room a daily Draw on Liquidity offers. Match the ambition of your R to the size of the move the setup can realistically produce.
Notice the hit-rate column moves opposite to the R column. Scalps resolve inside a single kill zone, so a larger share reach a nearby 1:2 target before conditions change.
Swings must survive hours or days of noise to reach a distant pool, so fewer complete — but the ones that do pay 4R or 5R. Neither profile is superior; they are two different points on the same expectancy curve.
A coherent trader picks one and sizes the target to it rather than mixing a swing's ambition onto a scalp's timeframe.
Worked Example: From Levels to R, and How Partials Change It
Take a bullish EURUSD intraday setup during the New York AM window. Price sweeps the London low, displaces up, and leaves a Fair Value Gap (FVG). You enter the gap fill at 1.0850. Your stop goes below the sweep low at 1.0834 — a 16-pip risk.
The Draw on Liquidity is the previous day's high at 1.0914, a 64-pip reward. That is 64 ÷ 16 = 1:4.
The all-or-nothing version
If you hold the full position to 1.0914, a win is +4R and a loss is −1R. At a measured 30% hit rate, expectancy = (0.30 × 4) − (0.70 × 1) = 1.20 − 0.70 = +0.50R per trade. Profitable, but with wide swings.
The partial-taking version
Now suppose you bank half the position at 1:1 (1.0866) and let the rest run to 1:4. Realized R on a full winner becomes (0.5 × 1) + (0.5 × 4) = 2.5R instead of 4R.
On trades that hit +1R and then reverse, you salvage +0.5R instead of a full loss. Partials cut variance and smooth the equity curve, but they mechanically lower your average R on your best trades. There is no free lunch — you are buying consistency with upside.
Log both the theoretical R and the realized R. The gap between them is your execution tax.
Why Chasing 1:10 Fails, and How to Measure Your Real R
The reason 1:10 dreams blow up accounts is simple: hit rate collapses faster than the ratio rewards you. Pushing a target from the near liquidity pool to one three structures away might raise R from 4 to 10.
But if that drops your hit rate from 30% to 8%, expectancy goes from +0.50R to (0.08 × 10) − (0.92 × 1) = −0.12R.
You traded a winner into a loser by getting greedy with the target.
The fix is data, not opinion. Measure your setup's real behavior:
- Log MFE and MAE for every trade — the Maximum Favorable Excursion (how far price ran your way) and Maximum Adverse Excursion (how far it went against you before resolving). These tell you the R your setup actually delivers versus what you claim.
- Find where MFE clusters. If most winners top out near 3.2R, targeting 5R is fantasy; your realistic ceiling is ~3R.
- Compute hit rate at each R. Bucket outcomes: what fraction reached 2R, 3R, 4R? The curve where win-rate-times-R peaks is your optimal target.
- Include costs. Spread, commission, and slippage shave every R. On a 16-pip stop, a 1-pip spread is over 6% of your risk — account for it before calling a plan profitable.
A scanner that timestamps setups and their outcomes makes this measurable at scale; LiquidityScan flags order block, FVG, and sweep setups with entry context so you can track how far each actually travels. Your good risk reward ratio in ICT is the one your own logged data supports — found, not chosen.
Three habits corrupt the data before you can trust it. First, moving the target mid-trade — trailing a stop up to grab more, or cutting the target short out of fear — means your logged R never matches your plan, so you can never audit the plan.
Second, having no fixed rule at all: if entry, stop, and target are decided in the moment, you have a collection of one-off bets, not a measurable setup. Third, ignoring transaction costs, which quietly turns a marginal +0.1R strategy negative.
Fix the rule first, log religiously, and only then argue about whether 1:3 or 1:4 is right for the good risk reward ratio in ICT your data supports.
Frequently Asked Questions
Is 1:1 risk-to-reward ever acceptable in ICT?
Only if your win rate clears 50% net of costs, which is hard to sustain. ICT structure usually lets you place stops tight enough to reach 1:2 or better, so most traders treat 1:1 as leaving edge on the table. Reserve it for high-conviction reclaims where a fast, reliable move outweighs a smaller ratio.
Should I count R:R before or after taking partials?
Track both. Your planned R:R (from entry, stop, and full target) sets the trade thesis. Your realized R after partials measures what you actually banked. The difference reveals whether early profit-taking is protecting you or quietly capping your edge below what the setup offers.
Does a higher risk-reward ratio mean a better strategy?
No. A higher ratio lowers the breakeven win rate but almost always lowers the actual hit rate too, because distant targets are reached less often. A 1:2 setup at 45% can out-earn a 1:6 setup at 15%. Expectancy, not the ratio alone, ranks strategies.
How many trades before I trust my average R?
Aim for at least 30–50 trades per setup type before drawing conclusions, and more if outcomes are volatile. Small samples let a couple of outlier runners inflate your average R and hide a weak hit rate. Segment by setup and session so you are not averaging across dissimilar conditions.
Related query paths
Build out the risk side of your ICT model with these next, ordered from framework to measurement:
- ICT Risk Management Framework — where R:R fits inside the full risk system.
- ICT Position Sizing: Risk, R-Multiples & Consistency — turn your R targets into consistent position sizes.
- The Institutional SMC Stop Loss and Take Profit Strategy — place the stops and targets that create your R.
- Order Block Stop Loss & Take Profit Rules — exact level placement for order block trades.
- How to Backtest an ICT Strategy the Right Way — measure the real win rate behind your R.
- 5 ICT Risk Management Mistakes — the errors that wreck your realized ratio.
- Risk-to-Reward vs Win Rate: Which Matters More for Profitability? — a related angle on win rate vs risk reward.