
What is the COT Report and Why Does It Matter for ICT?
The Commitment of Traders (COT) report is a weekly publication from the U.S. Commodity Futures Trading Commission (CFTC) that provides a transparent breakdown of positioning in futures markets. For ICT traders, it is the highest-level view of institutional order flow available, revealing the aggregate positions of the market's largest participants. This isn't about a single trade; it's about the foundational sentiment that drives weekly price expansion.
While price action on a 1H or 4H chart shows us the *what*, the COT report helps us understand the *who* and *why* behind major market moves. It gives us a data-driven reason to anticipate a bullish or bearish week, providing the directional bias that all our lower-timeframe analysis should operate within. Fighting the COT positioning is like swimming against a powerful tide; it's possible for short bursts, but ultimately exhausting and unprofitable.
The Key Players: Commercials vs. Large Speculators
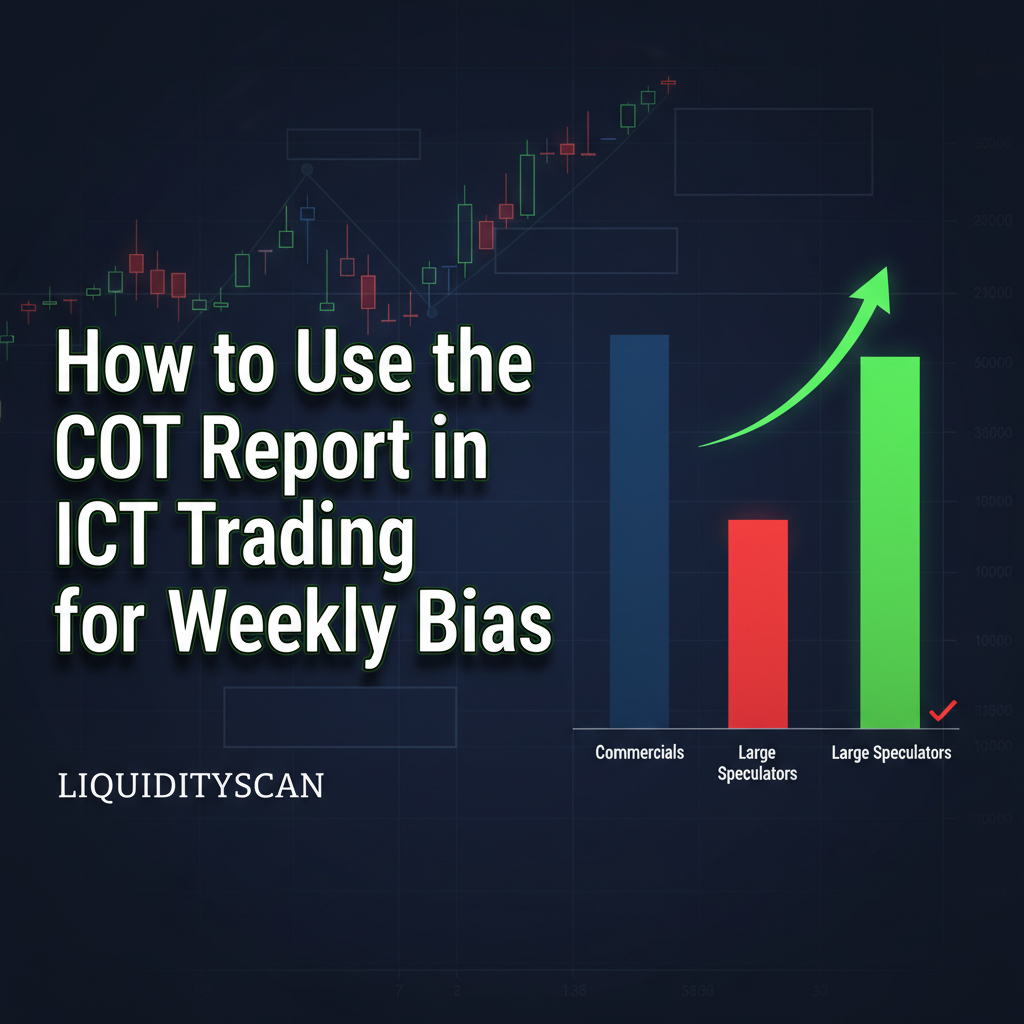
The core of ICT's COT analysis hinges on understanding the dynamic between two primary groups: Commercials and Large Speculators. These two groups trade for fundamentally different reasons, and the tension between their positions often precedes significant shifts in the market. The data is published by the CFTC and is also well-documented by exchanges like the CME Group.
Commercials (Hedgers): The 'Smart Money'
Commercials are entities that produce or use the underlying commodity or financial instrument. Think of a multinational corporation like Boeing hedging against fluctuations in jet fuel prices, or a major bank hedging its foreign currency exposure. Their primary goal is not speculative profit; it's risk management. They are considered the 'smart money' because they have an intimate, real-world understanding of supply and demand for the asset they are hedging.
In ICT analysis, Commercials are viewed as value players. They tend to buy into falling prices (accumulating longs) and sell into rising prices (accumulating shorts) to lock in favorable rates for their business operations. When Commercials are at a net-long extreme, it suggests they view current prices as a bargain. When they are at a net-short extreme, they see prices as expensive.
Large Speculators (Funds): The Trend Followers
Large Speculators, also known as Non-Commercials, are large traders like hedge funds and commodity trading advisors (CTAs). Their sole purpose is to profit from price movements. Unlike Commercials, they do not have an underlying business need for the asset. They are momentum and trend-following participants.
These funds typically buy into rising markets and sell into falling markets. They are often on the wrong side of major market turning points. When Large Speculators are at an extreme net-long position, the market is often overbought and susceptible to a reversal. Conversely, an extreme net-short position suggests the market is oversold and a bottom may be forming.
A Step-by-Step Guide to Reading the COT Report for Weekly Bias
Analyzing the COT report is a weekly ritual, best done over the weekend to prepare for the Monday open. The process translates raw data into a clear, actionable directional hypothesis.
Step 1: Accessing the Correct CFTC Legacy Report
The official data comes directly from the CFTC. You'll want to navigate to the 'Current Legacy Reports' section and select 'Futures-Only' from the 'Chicago Mercantile Exchange' short format. While other report types exist, the Legacy report provides the clearest view of the Commercial vs. Non-Commercial dynamic that is central to this ICT method.
Step 2: Identifying Net Positions and Open Interest for Your Market
Find the market you trade, for example, the Euro FX (EUR/USD) or S&P 500 futures (ES). The key columns are 'Commercial' and 'Non-Commercial' long and short positions. To find the net position for each group, simply subtract their short positions from their long positions. A positive number indicates a net-long position; a negative number indicates net-short.
Step 3: Analyzing Positional Extremes and Net Position Flipping
A single week's data is noise. The signal comes from context. You need to look at the current net positions relative to their historical range over the past six months to a year. When Commercials reach a historical extreme in their net-long positions while Large Speculators are at a historical net-short extreme, it's a powerful signal that price may be poised for a major reversal to the upside. The opposite is true for a bearish reversal. A 'net position flip', where one group crosses from net-short to net-long, is also a significant event.
Integrating COT Data with ICT Market Structure
The COT report provides the bias, but price action provides the entry timing and framework. The real power comes from aligning the high-level institutional sentiment with your weekly and daily charts.
Aligning COT Bias with the Weekly and Daily Chart
If the COT data suggests a strong bullish bias (e.g., Commercials are net-long), your job on the weekly and daily charts is to look for signs of a market preparing to move higher. You should be framing your analysis around potential weekly expansion profiles. Has price recently swept sell-side liquidity and is now showing a market structure shift? This is the kind of price action that validates the COT sentiment.
Using COT Divergence as a Confluence for PD Arrays
A classic ICT setup is a divergence between COT positioning and price. For instance, if price makes a lower low but Commercials are buying more aggressively (their net-long position increases), this is a major bullish divergence. You would then look for price to trade down into a daily or weekly fair value gap (FVG) or a bullish order block. The COT divergence gives you added confidence that this PD array in a discount will hold and initiate a new leg up.
Case Study: EUR/USD COT Positioning and Weekly Expansion
Imagine the EUR/USD has been selling off for several weeks. Price is making lower lows. However, in the COT report, you notice Commercials have been steadily reducing their short positions and are now approaching a net-long extreme. Simultaneously, Large Speculators are piling into shorts, reaching a net-short extreme. This is a classic reversal signal. The following week, you would be on high alert. If price on the daily chart sweeps a key weekly low and then displaces higher, creating a CISD, your COT analysis provides the institutional backing to trade that reversal with conviction.
Common Pitfalls and Advanced Interpretation
Simply looking at the headline numbers can be misleading. A nuanced approach is required to avoid common traps and extract the most value from the data.
Why the COT Report is Not a Timing Tool
This is the most critical point. The COT report is a sentiment indicator, not a trigger. Extreme positions can build for weeks or even months before price finally turns. You cannot use the Friday report to enter a trade on Monday morning. Its sole purpose is to establish a directional bias, which you then confirm with lower-timeframe price action and specific ICT entry models during the London or New York kill zones.
Looking at Rate of Change, Not Just Absolute Levels
Sometimes the most powerful signal is not the absolute extreme, but the speed at which positions are changing. If Commercials aggressively flip from net-short to net-long over just a few weeks, it indicates a significant and urgent shift in their perception of value. This can often precede a very sharp and fast move in price.
Factoring in Seasonal Tendencies
For many commodity and currency futures, there are strong seasonal patterns. For example, certain agricultural commodities see price strength at specific times of the year due to harvest cycles. Layering your COT analysis with an understanding of these seasonal tendencies can add another powerful layer of confluence to your weekly bias.
Frequently Asked Questions
How often is the COT report released?
The COT report is released every Friday at 3:30 PM Eastern Time by the CFTC. The data reflects the positions held as of the close of business on the preceding Tuesday. This lag is why it's a sentiment tool, not a timing signal.
Can I use the COT report for intraday trading?
No. The COT report is a high-timeframe tool used to establish a weekly, and sometimes monthly, directional bias. Using it for intraday trading is a misapplication of the data and will likely lead to poor results. The bias it provides should be the backdrop for your intraday setups, not the setup itself.
Which COT report should I use: Legacy, Disaggregated, or Traders in Financial Futures?
For the classic ICT analysis focused on the Smart Money vs. Dumb Money dynamic, the Legacy report is the standard. It provides the cleanest separation between Commercial hedgers and Large Speculators. The other reports offer more granular data but can complicate this specific analytical model.
Does the COT report apply to crypto markets?
The traditional COT report from the CFTC does not cover most spot crypto markets. However, it does include Bitcoin and Ether futures traded on the CME. The same principles of analyzing Commercial vs. Speculator positioning can be applied to these products, though the participant dynamics can differ slightly from legacy markets.