
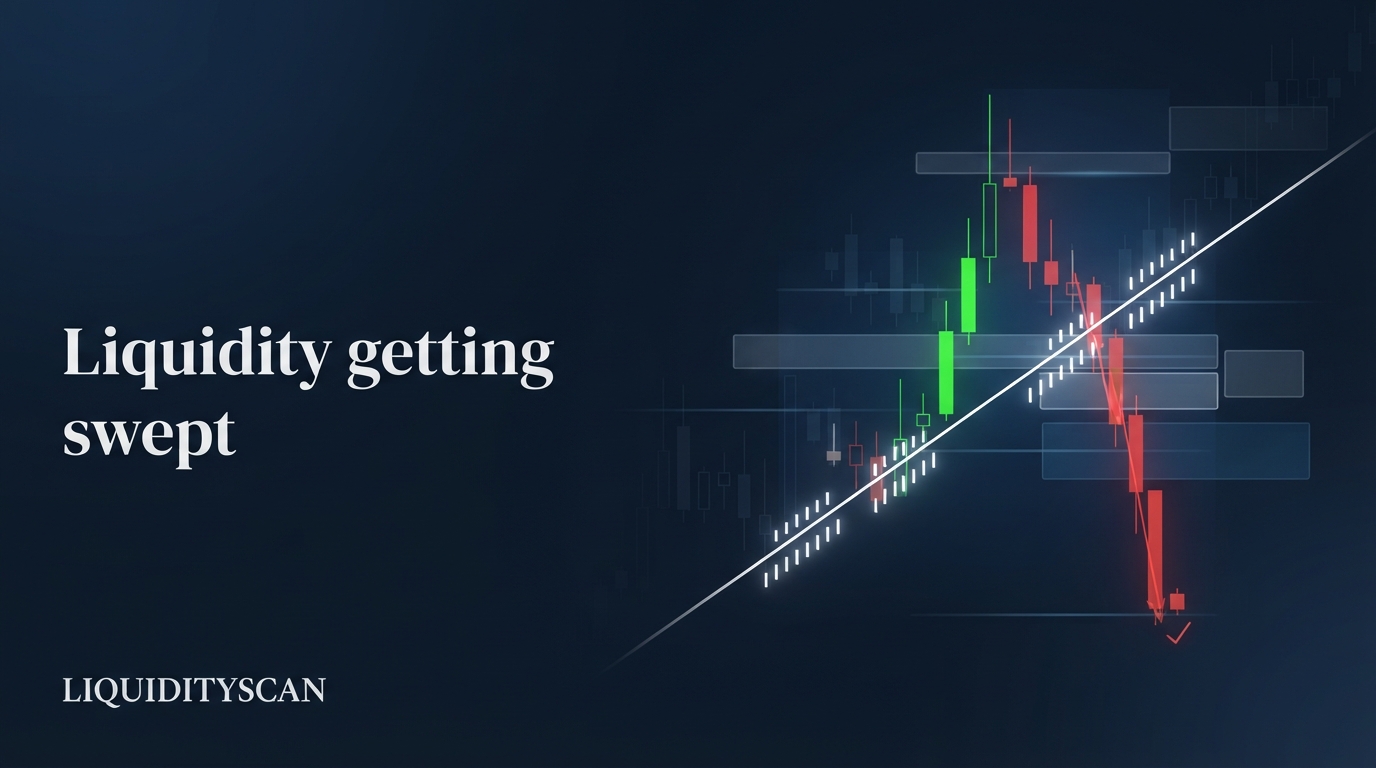
What Is Trendline Liquidity?
Trendline liquidity is the pool of resting orders that builds along a visible diagonal: stop-losses from trendline traders just beyond the line, plus breakout entries waiting for it to break. Price is drawn toward that pool rather than repelled by the line.
Under an ascending trendline, both order types point the same way. Longs who bought each bounce keep their stops just below the line — sell orders. Breakout traders park sell stops below it to catch the breakdown — also sell orders. The result is a dense band of Sell-Side Liquidity (SSL) tilted along the diagonal.
A descending trendline mirrors this: shorts’ stop-losses and breakout buy stops stack above the line as Buy-Side Liquidity (BSL). In both cases the line is not a wall. It is a map showing where a large cluster of executable orders will trigger if price trades through it.
That is why the phrase matters. “Support” implies price should hold. “Liquidity” implies price has a reason to visit. Reframing a diagonal as trendline liquidity changes the trade from buying the touch to waiting for the run through it.
Why Trendlines Attract Orders: Every Touch Adds Riders
A trendline gains liquidity the way a queue gains people: each successful test recruits more participants. Touch one is a coincidence. Touch two lets someone draw the line. Touch three “confirms” it in every classical technical-analysis playbook, and from that point the line appears on thousands of charts simultaneously.
Each new touch adds three order flows: fresh longs entering at the line, older longs trailing stops up beneath it, and breakout traders refreshing sell stops below the most recent touch. The pool compounds. A diagonal tested four times over three weeks on the 4H chart carries far more resting volume than a line tested once.
This creates the central paradox of trendline liquidity: the more valid the line looks, the more valuable it becomes as a target. Large participants need resting orders to fill size, because a large market order without opposing liquidity moves price against its own fill. A stop cluster is pre-committed counterparty volume sitting at a known location.
So the line’s popularity is its weakness. Maximum agreement means maximum fuel, and the moment of maximum agreement is usually the third or fourth touch — exactly where retail position sizing is heaviest and stops are tightest.
The ICT View: Trendlines Are Diagonal Equal Lows, Not Support
In the ICT and Smart Money Concepts (SMC) framework, diagonal support does not exist as a causal force. Nothing in an order book enforces a slope. What exists is the liquidity that traders’ belief in the slope creates. ICT treats the trendline as a drawing of where stops rest — a liquidity map, not a barrier.
The cleanest way to internalize this is the equal-lows analogy. Equal Highs and Equal Lows (EQH/EQL) are horizontal engineered liquidity: a level tested twice with stops stacked behind it. A multi-touch ascending trendline is the same structure tilted. Each higher low is “equal” relative to the line, and the stops behind each touch form a connected ribbon of sell-side liquidity.
Once you see the ribbon, the market’s behavior stops looking random. Price does not “lose support”; it completes a delivery toward a Draw on Liquidity that has been building for weeks. In ICT’s IPDA framing, price seeks liquidity and efficiency — and a four-touch trendline is one of the largest untapped pools on the chart.
This also connects to Inducement: the touches themselves are the bait. Every bounce that rewards trendline buyers induces more participation, building the very pool that will eventually be run. The trend does not break because sellers suddenly overwhelmed buyers; it breaks because the pool finally got big enough to be worth collecting.
The Classic Trendline Liquidity Run, Step by Step
The pattern repeats across forex, indices, and crypto with remarkable consistency. It unfolds in four phases.
Phase 1: The build (touches one through three)
An impulse leg establishes a low, then successive higher lows form a clean diagonal. By the third touch the line is consensus. Momentum often deteriorates here — each bounce travels less distance than the last — but participation increases because the line now “works”.
Phase 2: The break
On the third or fourth approach, price does not bounce. A bearish candle closes through the line. Trendline longs’ stops trigger as market sells; breakout traders’ sell stops trigger as new short entries. Both flows hit the book in the same direction within minutes.
Phase 3: The cascade
Because every trader drew the line slightly differently and trailed stops at different distances, the sell-side pool is a band, not a level. Price chews through it progressively — a rolling cascade, not a single spike — until it reaches a discount PD Array below the line: an old low, a bullish Order Block, or an unfilled Fair Value Gap (FVG).
Phase 4: The reclaim — the fake breakdown
At the array, the cascade meets real institutional interest. Displacement fires back above the broken trendline, often within one to three candles on the execution timeframe. Now the trap inverts: breakout shorts are stuck below, and their stops above the line become buy-side fuel for the reversal leg. One purge, two fuel sources.
Worked example: a four-touch run on BTCUSDT
Consider a 4H uptrend from 54,000. Higher lows print at 56,100, 57,900, and 59,600 — three clean touches on one ascending line. Price makes a high at 64,800, and by the fourth approach the line projects to roughly 61,200. Social feeds are unanimous: as long as the trendline holds, targets sit above 65,000.
The fourth touch fails. A strong 1H candle closes at 60,900, and the cascade runs sell stops down to 60,380 — directly into a 4H bullish Order Block at 60,300–60,700 left by the rally off the second touch, with an old session low at 60,450 swept in the same move.
Within two 15m candles, displacement drives price back above 61,200. A 15m Change of Character (CHoCH) confirms at 61,550, leaving a fresh FVG at 61,250–61,400. Price retraces into the gap, then runs the buy-side above 64,800 over the following sessions, topping near 66,200. The trendline did not fail — it delivered.
How to Trade Trendline Liquidity (Not the Trendline)
The professional adjustment is simple to state and hard to obey: never be the trendline buyer on the fourth touch, and never be the breakout seller through it. Trade the purge and the reclaim.
Step 1: Establish higher-timeframe context
Fading a trendline break is a reversal trade against short-term flow, so the higher-timeframe draw must support it. In the BTCUSDT example, the daily trend was up and the buy-side above 64,800 was untouched — the breakdown ran against the HTF draw, which is exactly when fake breakdowns are most probable.
Step 2: Map the pool and the array beneath it
Mark the stop band just beyond the line, then look for a genuine discount PD array below it: a bullish Order Block, an FVG, or an untapped old low. This is the filter most traders skip. If nothing meaningful sits below the line, a break has nowhere logical to reverse from — skip the setup entirely.
Step 3: Let the purge happen
No anticipatory entries. The entry condition is that the sweep has already occurred: price traded through the line, tagged the array, and started rejecting. Entering before the purge means your stop becomes part of the pool you were supposed to be trading.
Step 4: Demand displacement and a structure shift
Confirmation is a fast, energetic reclaim: displacement back above the broken line, followed by a CHoCH or Market Structure Shift (MSS) on your execution timeframe — 5m to 15m for a 1H–4H line. Enter on the retrace into the FVG the reclaim leaves behind.
LiquidityScan’s sweep-and-reversal scanners flag this exact sequence — higher-timeframe pool taken, lower-timeframe reclaim confirmed — across hundreds of pairs, so the setup does not depend on staring at one chart all day.
Step 5: Place the stop where the logic lives
The stop goes below the purge low, beyond the array that produced the reversal — not back under the trendline. Targets are the opposing pool: the buy-side at old highs that the reversal now has fuel to reach. In the worked example: entry 61,350, stop 60,250, first target 64,800 — roughly 3R before any extension.
Trendline Liquidity vs Horizontal Liquidity Pools
Both are engineered liquidity, but they build and purge differently. Knowing which type you are looking at changes your expectations for speed, depth, and precision.
| Attribute | Trendline (diagonal) liquidity | Horizontal pools (EQH/EQL, old highs/lows) |
|---|---|---|
| Formation time | Slow — engineered over weeks of repeated touches | Fast — two tests can build the pool |
| Stop placement | Dispersed band (everyone’s line differs slightly) | Tight cluster behind one precise level |
| Purge behavior | Rolling cascade; deeper and more violent | Sharp single spike with quick rejection |
| Entry precision | Lower — needs a PD array below to define the floor | Higher — the level itself defines the sweep zone |
| Crowd visibility | Extreme — the most-drawn object in retail charting | High, but requires reading swing points |
| Typical reversal signal | Reclaim of the line plus CHoCH | Rejection wick, Turtle Soup-style reversal |
The practical consequence: diagonal purges need more room. Because stops are smeared along the slope, the cascade often overshoots what a horizontal-sweep trader would expect. Size the stop from the array below, never from the line itself.
The two also combine. When an ascending trendline intersects an old horizontal low, the pools stack — and stacked pools produce the most decisive sweeps on the chart, because one move collects both at once.
How to Spot a Trendline About to Be Run
The most reliable heuristic is obviousness. If every retail chart shows the same line — it circulates on social feeds, anchors to identical swing points, and appears in daily analyst notes — it is not protection, it is a target. Liquidity concentrates where agreement concentrates.
Beyond obviousness, these conditions raise the probability of a run:
- Three or more clean touches. The pool is large enough to be worth collecting, and retail conviction is at its maximum.
- Fading momentum into the line. Each bounce travels less than the previous one — participation at the line rises while follow-through falls.
- A discount PD array below. The market has somewhere logical to deliver price to; purges into an Order Block or old low are far more common than purges into a vacuum.
- Timing windows. Breaks inside the London or New York kill zones, or on a news impulse, are far more likely to be liquidity runs than slow drifting breaks.
- Confluence with a horizontal level. Stacked pools get collected together.
The drawing mistakes that get traders swept
Two habits destroy this analysis. The first is forcing lines: bending anchors through wicks on one touch and bodies on another until a diagonal appears. If you have to force it, other traders do not see it — and a line nobody else sees carries no pool. Trendline liquidity is a crowd phenomenon; no crowd, no liquidity.
The second is re-drawing after every break. Adjusting the line so it is “still valid” produces a fan of hope-lines and blinds you to what the break just told you: the original pool was collected. That original line mattered because the original stops lived there. Once it is run, its job is done — analyze the reclaim, do not resurrect the line.
Treat every popular diagonal on your chart as trendline liquidity first and support second. Ask where the stops rest, what array sits beyond them, and who gets trapped when the line breaks — and you stop donating to the purge and start trading it.
Frequently Asked Questions
Do institutions actually see where retail traders draw trendlines?
They do not need your chart. Stops cluster in predictable places relative to visible swing points, and multi-touch diagonals are among the most standardized drawings in retail technical analysis. Any participant modeling resting-order density can infer the stop band from structure alone — the same way equal lows imply stops without anyone seeing an order book.
Is every trendline break a liquidity sweep?
No. Genuine breakdowns exist, especially when the higher-timeframe draw already points down. The tells differ: a sweep breaks into a discount array and reclaims the line with displacement within a few candles; a real break holds below the line, retests it as resistance, and continues lower. No reclaim, no reversal trade.
What timeframe is best for trading trendline liquidity?
Lines drawn on the 1H, 4H, and daily charts carry the most riders and therefore the most meaningful pools. Execute the reversal on the 5m–15m charts, where displacement and a change of character are readable. Diagonals on sub-15m charts re-form constantly and carry too little resting volume to produce reliable runs.
How is a trendline liquidity run different from a Judas Swing?
A Judas Swing is defined by time: the false directional move early in a session, engineered before the real delivery. A trendline liquidity run is defined by structure: the purge of a multi-touch diagonal. They often coincide — a trendline break during the London or New York open is frequently both at once.
Related query paths
Where to go next depends on which part of the mechanism you want to master: the sweep itself, the pools being targeted, or the arrays you reverse from.
- What Is a Liquidity Sweep? — the parent concept: what it means when a resting pool gets run.
- Equal Highs & Equal Lows (EQH/EQL): Engineered Liquidity — the horizontal cousin of trendline liquidity.
- BSL vs SSL in SMC: Identify Liquidity — which side of the pool you are targeting and why it matters.
- Internal vs External Liquidity: An SMC Trader’s Guide — classify pools so you know which draw is actually in play.
- Inducement vs Liquidity Sweep: A Trader’s Guide to SMC Setups — how the bait that builds the pool differs from the run that collects it.
- PD Array ICT Explained: A Trader’s Guide to Premium & Discount — the arrays below the line that define where the purge reverses.
- What Is Inducement (IDM) in Smart Money Concepts? — how it connects to what is inducement smc.
- liquidity sweep vs liquidity grab — Explains whether trendline sweeps are grabs and how to read the reclaim.