
What Is a Market Structure Scanner?
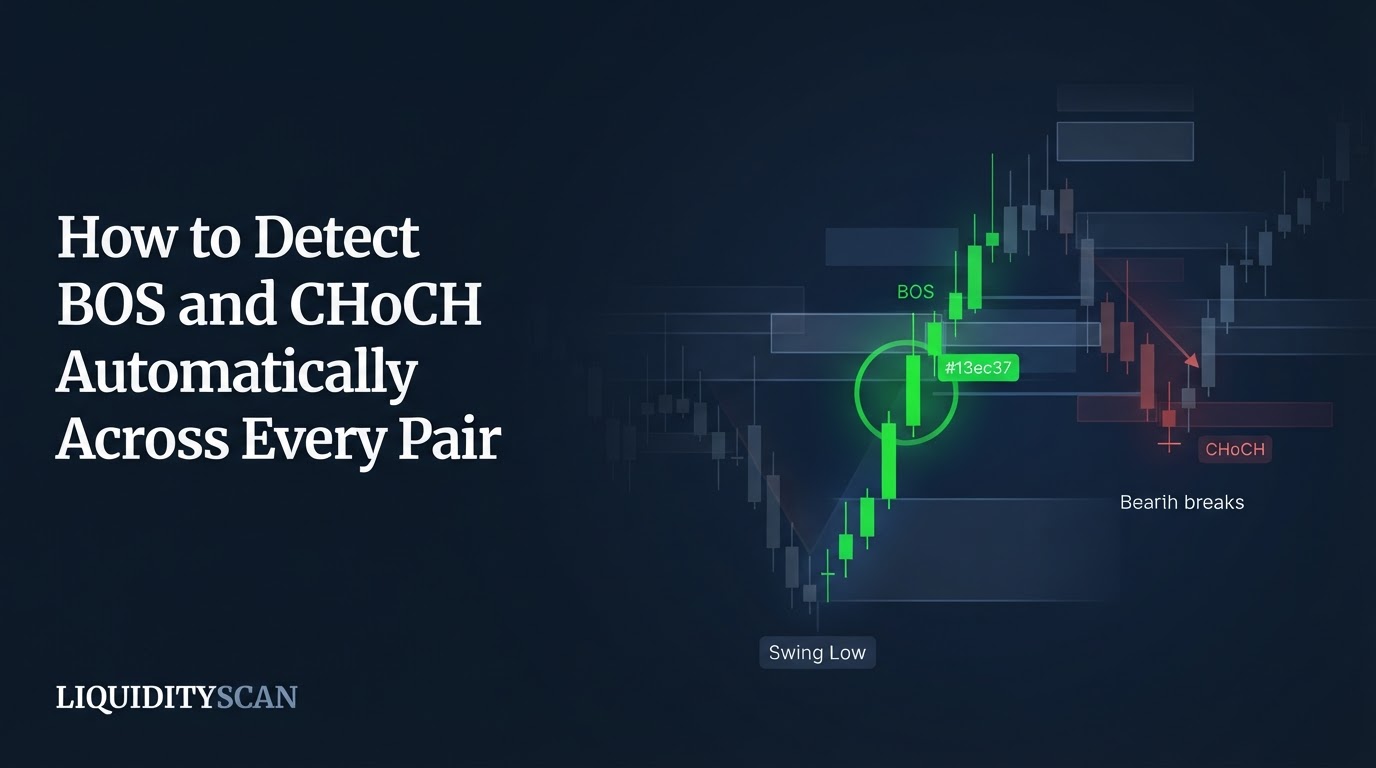
A market structure scanner reads price swings on every pair and automatically flags two events: a Break of Structure (BOS), which signals trend continuation, and a Change of Character (CHoCH), which signals a possible reversal. One fixed rule, applied to every chart.
Applying one rule to every chart is the point: the read never drifts trade to trade. Whether you check a chart today or next week, the same swing produces the same label.
The value is objectivity and coverage. Instead of eyeballing swing points on one chart, the scanner classifies the same event the same way across hundreds of symbols and four timeframes at once, on closed candles that do not repaint. It tells you what structure just did; it does not tell you to buy or sell.
That distinction is the whole point. Market structure is the backbone of Smart-Money analysis, because BOS and CHoCH are how you read trend and the moment it flips before price reaches your point of interest.
Automating the read does not replace your judgment. It removes the two failure points that quietly corrupt manual structure work: inconsistent swing marking and incomplete coverage. What is left is a clean, repeatable feed of structural events you can reason from.
Why Hand-Marking BOS and CHoCH Is Slow and Inconsistent
The bottleneck in manual structure reading is not the break test, it is swing selection. Two traders on the same leg anchor to different highs and lows, so one sees a clean BOS while the other sees noise. Even the same trader, a week apart, picks different pivots. Structure only feels objective until you compare notes.
Scale makes it worse. To scan 200 pairs across 1h, 4h, 1d, and 1w by hand is 800 charts, and by the time you finish the first fifty the earlier ones have moved. You end up reading a handful of favorites, which is exactly how the cleanest setup on a pair you were not watching slips past you.
- Ambiguous swings: was that a real pivot or a two-candle wiggle? The answer changes the entire structure count.
- Recency bias: after a big move you start seeing reversals everywhere and under-mark continuations.
- Confirmation drift: once you have a directional opinion, you unconsciously mark the swings that support it.
- Coverage gaps: nobody watches every pair on every timeframe, so events fire on charts you never open.
What an Objective Structure Scanner Must Encode
To remove the subjectivity, a scanner has to freeze three decisions that human traders make loosely: how a swing is defined, what counts as a break, and which resolution of structure it belongs to. Get these three right and structure becomes reproducible; get any one wrong and the output is just automated guessing.
1. A fixed swing rule
Before you can call a break, you need to define a swing high and swing low mechanically, not by feel. A common definition is the 3-candle rule: a swing high is a candle whose high is higher than the candle on each side. Fix that pivot definition and every chart is measured against the same yardstick.
2. The close-through test
A break is only a break when price closes beyond the reference swing, not when a wick pokes through it. Requiring a body close filters out the liquidity sweeps and stop-runs that briefly pierce a high or low and snap back. This single test separates a genuine structural shift from noise.
A trader who counts wicks marks twice as many breaks, and most fail, because a wick beyond a high is often the algorithm reaching for stops rather than confirming direction. Encoding the close-through test is the difference between a market structure scanner and a highs-and-lows highlighter.
3. Major vs Minor resolution
Structure is fractal, so one label is not enough. The scanner needs to track breaks at two resolutions: Major (the significant swing points that define the dominant trend) and Minor (the internal, smaller swings inside a leg). A Minor CHoCH inside an intact Major uptrend means something very different, and conflating the two is how traders get chopped up.
How the LiquidityScan Market Structure Scanner Defines BOS, CHoCH, Major and Minor
LiquidityScan's Market Structure scanner is a faithful port of the TradingFinder SMC indicator, so the definitions are code, not opinion. It classifies four things and nothing more, which keeps the output honest.
- BOS (continuation): price closes through the most recent swing in the direction of the existing trend. An uptrend that closes above its last swing high has confirmed continuation.
- CHoCH (reversal): price closes through a swing against the prevailing trend, the first structural sign the leg may be flipping. An uptrend that closes below its last higher low prints a CHoCH.
- Major: the same tests applied to the significant swing points that frame the dominant trend.
- Minor: the same tests applied to the internal swings inside a leg, for traders who want to see structure shift early.
The scanner computes each of the four timeframes, 1h, 4h, 1d, and 1w, independently. It is not cascading a higher-timeframe bias down to a lower one; a 4h BOS and a 1d CHoCH are separate reads you combine yourself. Everything runs on confirmed, closed candles only, so a structure label never repaints after the bar closes.
Simple Mode vs Sequence Mode
The scanner runs in two modes, and the second is the reason it does more than mark a single event.
Simple mode surfaces the latest BOS or CHoCH per symbol and timeframe. This is your at-a-glance structure map: scan the market, see which pairs just continued and which just changed character, and read bias from there. It answers "what did structure do last?"
Sequence mode is the standout. Structure rarely tells its story in one event; it tells it in an ordered chain. Sequence mode fires only when a user-defined pattern of up to three events completes in order, for example CHoCH then BOS then BOS: character changes, then the new direction confirms, then confirms again.
A single CHoCH is a hint; a CHoCH followed by two BOS in the new direction is a story. LiquidityScan ships a curated 12-item sequence catalog (four two-step and eight three-step patterns) grouped as reversal, continuation, warning, and whipsaw, so you watch for a specific structural narrative rather than a lone flag.
Because each leg must close after the previous one, order is enforced, not just co-occurrence. That is what turns raw events into a readable market structure scanner output you can act on with context.
The catalog groupings map to how the events actually resolve. A reversal sequence like CHoCH then BOS then BOS says a trend flipped and then confirmed the flip twice. A continuation sequence of stacked BOS in one direction says the existing trend is pressing on, printing fresh higher highs or lower lows.
A warning pattern flags a Minor CHoCH inside an intact Major trend, the kind of early crack that either fails or precedes a larger turn. A whipsaw pattern captures the back-and-forth that chops discretionary traders up. Picking the group that matches your thesis filters the market to the one structural story you are hunting, instead of every isolated flag.
Manual Structure Reading vs a Market Structure Scanner
| Dimension | Manual structure reading | Market structure scanner |
|---|---|---|
| Swing selection | By eye; varies trader to trader and day to day | One fixed pivot rule applied identically everywhere |
| Break test | Often "looks broken" (wick counts) | Body close-through required; wicks rejected |
| Resolution | Usually one level of structure at a time | Major and Minor tracked in parallel |
| Coverage | A few favorite pairs and timeframes | Every pair across 1h/4h/1d/1w each scan |
| Repainting | Marks get redrawn as opinion shifts | Closed-candle only; labels are stable |
| Ordered stories | Held loosely in memory | Sequence mode enforces CHoCH to BOS to BOS order |
| Output | A drawn bias | A flagged structural event, not an entry |
A Worked Example and Honest Limits
Say ETHUSDT has been in a 4h downtrend: a series of lower highs and lower lows, each new low a Major BOS down. Price sweeps a prior low, then the next candle closes back above the last lower high. That close prints a Major CHoCH, the first crack in the downtrend. Alone, it could be a bull trap.
Consider what hand-marking would have cost you here. On a downtrending ETHUSDT you were probably biased short, so the first close above the lower high looks like a wick to fade, not a CHoCH to respect.
The scanner has no bias: it applies the close-through test, sees a body close beyond the swing, and labels it. That is the confirmation-drift problem solved mechanically, on a pair you may not even have had open.
Now the scanner watches for the rest of the chain. Price pulls back, forms a higher low, and closes above the CHoCH swing: a BOS up, confirming the new direction. A second higher low then higher high closes through again: a second BOS up.
The Sequence mode setup for CHoCH then BOS then BOS is now complete, and it fires as a single reversal signal on ETHUSDT 4h. You did not watch tick by tick; the scanner assembled the ordered story and flagged the finished pattern.
What happens next is your job, and here are the honest limits. The scanner flags structure events, not trades. It outputs no entry, no stop, no target, and no win rate, because it does not compute one.
A completed CHoCH-to-BOS sequence tells you character flipped and confirmed. Where you enter, how you size, and whether you take it at all is analysis you layer on top, ideally against your own Draw on Liquidity and a premium/discount read.
When a setup completes, LiquidityScan can deliver it via web and native push and an in-app alert, so you catch it without staring at charts. Treat the output as a fast, consistent structure feed, not a trade call.
The workflow is the same whether you run Simple or Sequence mode: the market structure scanner flags the BOS, CHoCH, or completed sequence, you read bias and draw your levels, and you execute on your own rules. Automation buys consistency across every pair and every timeframe; the trade decision stays yours.
Frequently Asked Questions
Does a market structure scanner repaint its BOS and CHoCH labels?
No. LiquidityScan's Market Structure scanner detects on confirmed, closed candles only and drops the live forming bar. A BOS or CHoCH is classified once the candle closes and is not redrawn afterward, which matters because a structure signal you can trust must be stable, not a label that shifts as the next bar prints.
What is the difference between Major and Minor structure?
Major structure is the break of the significant swing points that define the dominant trend; Minor structure is the same test applied to the smaller internal swings inside a leg. A Minor CHoCH can fire while the Major trend is still intact, giving early warning without necessarily meaning the higher-timeframe trend has reversed.
Why require a candle close instead of a wick to confirm a break?
Wicks routinely pierce swing highs and lows during liquidity sweeps and stop-runs, then snap back inside the range. Requiring a body close beyond the reference swing filters those false breaks out, so BOS and CHoCH labels reflect a real shift in delivery rather than a momentary spike that reverses immediately.
Can it tell me where to enter a trade?
No. The scanner flags structural events and, in Sequence mode, completed ordered patterns. It does not output entries, stops, targets, or performance figures. You read bias from the flagged event, draw your own levels, and decide execution. It is an objective structure feed, not a signal service or financial advice.
Related query paths
Follow the structure-reading journey from definition to objective detection with these next reads.
- What Is Market Structure in ICT? — the foundation the scanner automates.
- Swing High and Swing Low: 3-Candle Rule — the fixed pivot rule that makes detection objective.
- What is a Break of Structure (BOS)? — the continuation event, defined precisely.
- Change of Character (CHoCH) Guide — the reversal event and how to spot it early.
- BOS vs. CHoCH: The Definitive Guide for SMC Traders — the two events side by side.
- Is Market Structure Subjective? — why encoding the rules removes bias.
- How to Catch Asian-Range Sweeps Every Session — a related angle on asian range sweep scanner.