
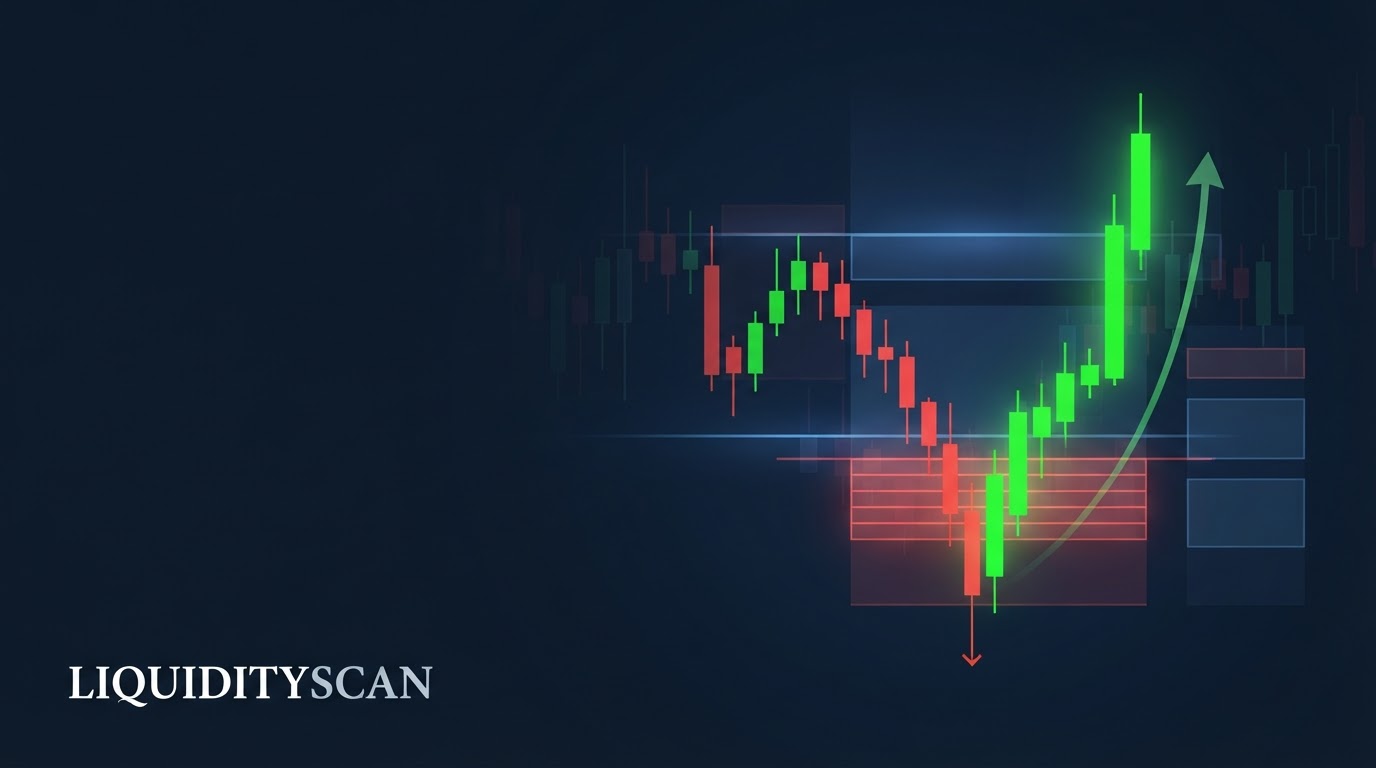
Why Does Price Reverse After a Liquidity Sweep?
Price reverses after a liquidity sweep because the sweep converts resting stops into executed market orders — the one pool of counterparty volume large enough to fill institutional size. Once those orders are absorbed, the pressure that drove price there vanishes and the imbalance flips.
That single sentence contains the entire logic of institutional execution. A fund that needs to buy 2,000 BTC — or $500 million of EUR/USD — cannot simply hit the market with the full order.
Passive liquidity at any single price is thin, so a market order of that size would walk the book upward, worsening the average entry with every fill. Large buyers need large sellers, delivered at a known price, at a known moment.
Stop orders solve exactly that problem. Every stop-loss resting below a swing low is a committed sell market order waiting for a trigger price. Cluster enough of them — under Equal Lows (EQL), beneath a multi-touch trendline, under yesterday's session low — and you have a pre-built pool of guaranteed sellers at a fixed location.
In ICT terms that pool is sell-side liquidity, and it functions as a Draw on Liquidity: price gravitates toward it precisely because size can be executed there and almost nowhere else.
So the sequence is mechanical, not conspiratorial. Price runs the level, stops fire, institutions absorb the forced selling, and the aggressive flow that created the down-move ends the instant the pool is empty. What remains is a market that has just spent its sell orders — into the hands of patient buyers.
The scale involved makes this unavoidable: the FX market alone turns over roughly $7.5 trillion per day according to the BIS 2022 Triennial Survey, and every participant moving institutional size confronts the same execution constraint on every trade.
None of this requires a villain, either. Any sufficiently large participant faces the identical choice — find resting volume or move the market against yourself — so order flow converges on stop pools naturally. The predictable part is not who runs the level; it is where the volume must come from.
The Order-Book Walkthrough: A Sell-Side Sweep Step by Step
Walk through a sweep of the lows in order-book terms. The mirror image — a buy-side sweep above equal highs — works identically with the directions flipped.
Step 1: Stops accumulate below the lows
Longs protect positions with sell stops under the most recent defended low. Breakout traders place sell stops at the same level as entries for a breakdown. To the matching engine both are the same object: latent market sell orders that activate the moment price prints the trigger. The longer a level holds and the more visible it is, the larger this hidden inventory grows.
Step 2: Price is delivered into the pool
Reaching the pool takes surprisingly little aggression, because everyone sees the same lows and few traders want to bid directly in front of them.
As price ticks through the level, the first layer of stops triggers; their market sells consume the bids below, price drops to the next layer, and that layer fires too. Each fill triggers the next. This is the cascade — self-sustaining selling that no one is actively choosing to do.
Step 3: Absorption at the extreme
The cascade is exactly what a large buyer ordered. Passive buy limits — frequently iceberged, so the full size never displays — sit beneath the lows and eat the forced selling.
On a footprint chart the signature is unmistakable: heavy negative delta printing while price makes no further downward progress. Enormous sell volume, zero result. That divergence between effort and movement is absorption, and it is the physical event behind every sweep reversal.
Step 4: The vacuum above
When the last stop fires, aggressive sell flow simply stops. There is no second wave, because the sellers were stop orders, not conviction.
Meanwhile the book above current price is hollow — bids were consumed on the way down, and ask-side liquidity was pulled during the flush. Even modest buying now lifts price rapidly back through the swept level. The imbalance has flipped from all-sell to all-buy in the space of a few candles.
Why the Reversal After a Sweep Is Often Violent
The snap-back is rarely gentle, and the reason is positioning, not magic. At the sweep low, virtually every trader who acted in the last few minutes is on the wrong side:
- Breakdown shorts are trapped instantly. They sold the low of the move; every tick higher puts them further offside, and their exits are buy orders.
- Stopped-out longs still want long. Their bias has not changed — only their position. They chase back in higher, adding more buy flow.
- The book above is thin. With resting offers cleared or pulled, each unit of buying travels much further than it would in a balanced market.
Crypto adds an accelerant: perpetual-futures liquidations. When leveraged longs are liquidated below the lows, the exchange itself force-sells their positions — market orders no trader can cancel or reconsider.
This is why sweep reversals on BTC and high-open-interest altcoins are often more explosive than their FX equivalents: the cascade includes involuntary flow, and once it clears, open interest has been flushed and the path upward is unobstructed.
All of that forced buying compresses into Displacement — a fast, one-directional expansion that frequently leaves a Fair Value Gap (FVG) behind because price moved too quickly for two-sided trade. Sweep, then displacement through structure, is the signature ICT traders wait for. Older frameworks recognized the same mechanics: Linda Raschke's Turtle Soup traded failed breakouts of 20-day extremes decades before SMC vocabulary existed.
When Price Does Not Reverse After a Liquidity Sweep
The honest half of the answer: sometimes the level breaks for real and price never comes back. Three situations account for most failed sweep-reversal trades.
A genuine break, not a sweep
Watch the candle bodies. A sweep pierces the level with a wick and closes back inside the prior range; a genuine break closes body-through the level and keeps delivering — displacement continues in the breakout direction instead of reversing.
If the first candle beyond the low closes near its own low and the next candle follows through, the market is finding fresh sellers, not merely triggering old stops. That is redistribution, and fading it is standing in front of the move.
The higher-timeframe draw sits beyond the level
A 5-minute "sweep" of an intraday low means little if the daily chart shows unfinished business lower — an untapped weekly low, a large daily FVG, an old imbalance. Price routinely sweeps minor pools en route to the real Draw on Liquidity.
Every reversal thesis should therefore be checked one or two timeframes up: is there a bigger, more attractive pool just beyond the level you expect to hold? If yes, the "reversal" is likely a pause.
News repricing
Scheduled releases — CPI, FOMC, NFP — reprice expectations rather than harvest stops. When a level breaks on genuine new information, the move reflects a changed consensus of fair value, and mean-reversion logic does not apply. A sweep pattern printed two minutes after a hot inflation number carries a structurally different risk profile than the same pattern at a quiet London open.
Finally, not every wick is a sweep. A lower wick only carries meaning when a real, visible pool existed at that level — equal lows, a prior session extreme, a well-tested trendline — and when price reclaims the level afterward. Random wicks in the middle of a range are noise, and labeling them sweeps in hindsight is curve-fitting, not analysis.
How to Confirm the Reversal Before You Trade It
The sweep itself is context, not a trigger. Professionals wait for evidence that absorption actually happened before committing risk:
- Reclaim close. A candle body closes back above the swept level on the timeframe of the pool. A wick alone proves nothing — bodies show who won the auction.
- CISD or MSS. After the sweep, price breaks the structure of the down-leg. Change in State of Delivery (CISD) is the close through the opening prices of the final series of down-close candles; a Market Structure Shift (MSS) is the displacement break of the last lower high. Either one demonstrates that buyers now control delivery rather than merely pausing the decline.
- SMT divergence. A correlated asset refuses to confirm the new low — ES prints a lower low while NQ holds, or BTC sweeps while ETH does not. SMT Divergence at a liquidity pool implies the weakness was engineered rather than genuine.
Stack them. A sweep with a reclaim close, a structural shift, and SMT agreement is a categorically different bet than a lone wick. Each independent confirmation removes one failure mode from the list above.
Why sweeps cluster at session opens and kill zones
Timing is not decoration; it is part of the mechanism. The Asian session typically builds a defined range, so stop pools accrete at both of its extremes overnight. The London and New York opens then deliver the volume surge institutions need to both run the pool and absorb it — you cannot execute size into a dead market.
That is why sweep-reversals concentrate inside the classic Kill Zones, and why the London-open Judas swing — a false move engineered to raid one side of the overnight range — is the canonical example of the pattern.
LiquidityScan's sweep scanner watches for exactly this sequence across crypto pairs in real time, flagging higher-timeframe sweeps and their reclaim confirmations so the setup finds you rather than the reverse.
Structuring the Trade: A Worked BTCUSDT Example
BTCUSDT, 1-hour chart. Price has defended the 61,800 area twice in three days, printing lows at 61,820 and 61,790 — equal lows within 0.05%, a textbook engineered pool. Buy-side liquidity rests at the range high of 63,400. The daily context is constructive: price holds above a rising daily open, and no untapped daily-level pool sits below the equal lows.
At the New York open, a fast 15-minute drive breaks 61,790 and prints 61,430 — roughly 0.6% through the pool. Volume spikes to about three times the 20-bar average while price stalls at the low: absorption.
The next 15-minute candle closes at 61,950, back above both old lows — the reclaim — and the impulse leaves a fair value gap between 61,950 and 62,150 while breaking the last lower high of the decline.
The trade structures itself from the mechanics. Entry on the retracement into the gap at 62,000. Stop below the sweep extreme at 61,350 — never at the old lows, which no longer hold anything — for 650 points of risk. Target the opposite pool at 63,400, for roughly 1,400 points and a little over 2R.
If price closes back below 61,430 after entry, the absorption thesis is dead: exit, no averaging, no negotiating.
The template generalizes to any market and timeframe: identify the pool, wait for the raid, demand a reclaim plus a structural shift, enter on the retracement into the displacement's FVG or Order Block, stop beyond the sweep extreme, target the opposite pool.
That is the complete answer to why price reverses after a liquidity sweep: the stops are the counterparty, absorption removes the pressure that created the move, and trapped traders finance the journey back. Trade the confirmation, not the wick.
Frequently Asked Questions
How long does the reversal after a liquidity sweep usually take?
It scales with the timeframe of the pool. Sweeps of intraday session lows typically reverse within a few candles on the sweep timeframe — minutes to a couple of hours. Sweeps of daily or weekly levels can base for a day or more first. If price consolidates below the swept level instead of reclaiming it quickly, odds shift toward continuation.
What is the difference between a liquidity sweep and a stop hunt?
Same event, different framing. "Stop hunt" is the retail-facing term implying traders are targeted; "liquidity sweep" describes the function — institutions executing size against triggered stops. Practically, a tradable sweep has two failures in a row: the level fails to hold price, then price fails to stay beyond the level. That second failure is what confirms it.
Can you actually see a liquidity sweep in the order book or footprint?
Partly. Footprint charts show the signature — heavy sell delta at the lows with no further downward progress, plus a cumulative-delta divergence at the extreme. The institutional bids themselves are usually hidden as iceberg orders, so you observe the effect, not the resting size. The raw DOM alone is unreliable because displayed size can be pulled or spoofed.
Do liquidity sweeps work on higher timeframes?
Yes — often better. Daily and weekly extremes accumulate far more stops, so sweeps there produce larger and cleaner reversals; failed breakouts of multi-week extremes have been documented since the 1990s. The trade-offs are wider stops and slower confirmation, which is why most traders map the pool on the higher timeframe and time the entry on a lower one.
Related query paths
Where to go next in the liquidity query network, in reading order.
- What Is a Liquidity Sweep? — the definition page: what qualifies as a sweep before you ask why it reverses.
- Liquidity Sweep Explained: The ICT Stop Hunt — the full ICT treatment of the stop-hunt model this article mechanizes.
- BSL vs SSL in SMC: Identify Liquidity — how to map the pools above highs and below lows before the raid happens.
- Equal Highs & Equal Lows (EQH/EQL): Engineered Liquidity — why matched extremes are the highest-density stop pools on any chart.
- What is SMT Divergence in ICT Trading? — the cross-asset confirmation tool for separating engineered sweeps from genuine breaks.
- London vs NY Liquidity Sweeps: Which Session Drives the Real Move? — applying sweep mechanics to session timing and kill-zone selection.
- Liquidity Sweep vs Liquidity Grab: Is There a Difference? — how it connects to liquidity sweep vs liquidity grab.