
Do Liquidity Sweeps Actually Work?
Liquidity sweeps work in a narrow, testable sense: the stop clustering that creates them is documented market microstructure, and rule-based sweep-reversal setups can produce positive expectancy. But the edge lives in the filters — pool selection, timing, and confirmation — not in the pattern itself.
"Working" here means something specific: a mechanical rule set — a defined sweep, a defined entry trigger, a defined stop, a defined target — that produces positive expectancy after costs across a statistically meaningful sample. Anything looser, like "price often reverses after wicks," is not a claim you can test, and therefore not one you can trade.
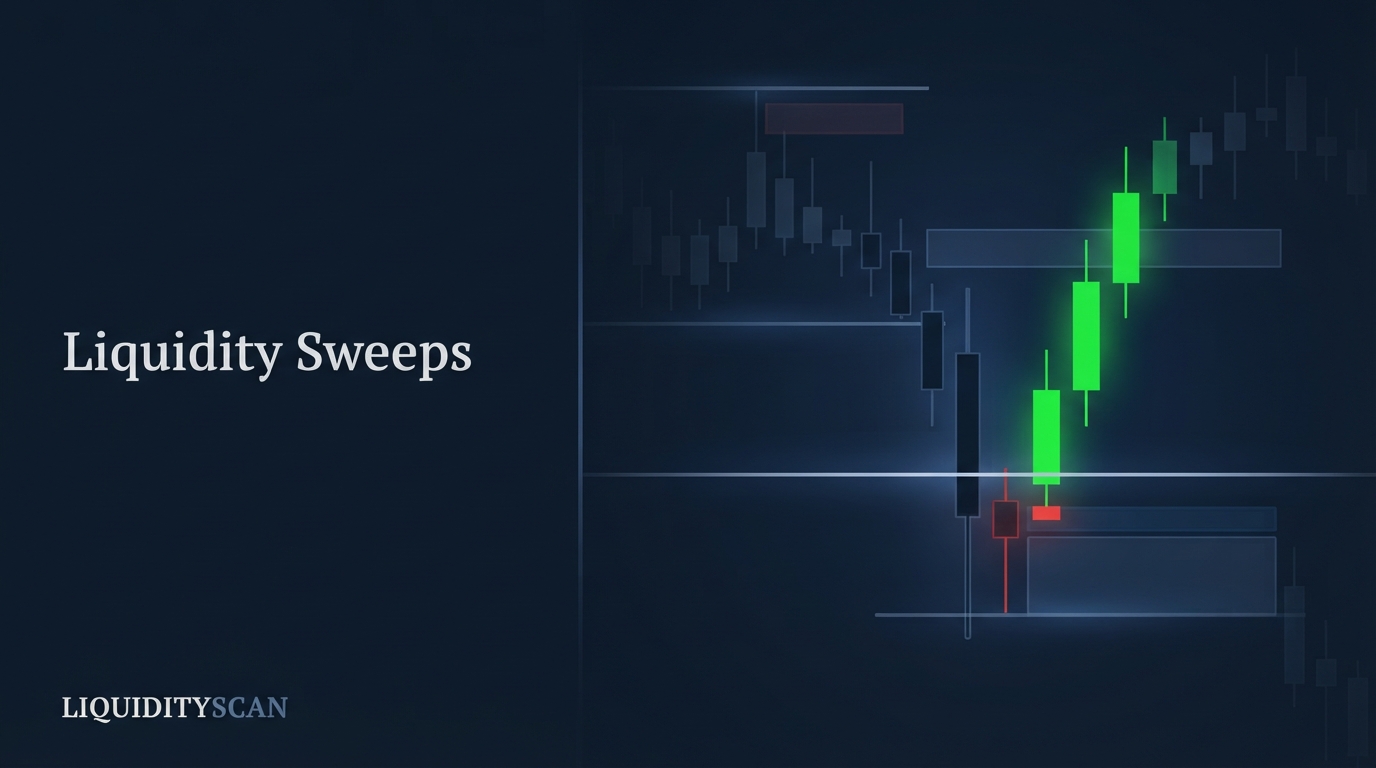
That framing matters because a liquidity sweep — price trading through a visible pool of resting orders, then reversing — is easy to see in hindsight and hard to trade in real time. The honest question is not whether sweeps happen; they demonstrably do. It is whether a rules-based sweep-reversal setup makes money once you account for every wick that looked identical and kept going.
Split the claim in two and the debate gets cleaner. The weak claim — obvious levels attract clustered orders, and running them creates genuine two-sided events — is well supported. The strong claim — any sweep of any level is a fade signal — is false, and it is the version most losing backtests actually test.
The Mechanical Case: Stop Clustering Is Documented Microstructure
The foundation is not trading-forum folklore. Carol Osler's research at the Federal Reserve Bank of New York analyzed thousands of actual stop-loss and take-profit orders placed at a major FX dealer. She found that stop-loss buy orders cluster just above round numbers, stop-loss sell orders cluster just below them, and that executing those clusters propagates self-reinforcing price cascades (Stop-Loss Orders and Price Cascades in Currency Markets, FRBNY Staff Report No. 150).
Translate that into Smart Money Concepts language. Levels every participant can see — Equal Highs and Equal Lows (EQH/EQL), the prior day's extreme, an old weekly low — accumulate dense pockets of Buy-Side Liquidity (BSL) and Sell-Side Liquidity (SSL): protective stops from positions on one side, breakout entries from traders on the other.
When price presses through such a level, two flows fire at once: clustered stops execute as forced market orders, and breakout traders enter in the same direction.
That burst of one-way flow needs continuous institutional interest to keep going. When that interest is absent — or when larger players are using the burst to fill positions on the opposite side — the move exhausts and snaps back through the level.
So a sweep is a genuine two-sided liquidity event, not chart-pattern superstition: forced flow meets absorbing flow at a price where resting orders are measurably concentrated. The mechanism is real. What the mechanism does not guarantee is that every sweep reverses, or that you can extract money from the ones that do.
What Backtests Show — and Why They Disagree
Community backtests — TradingView strategy scripts, forum studies, hand-collected sample sets — report results ranging roughly from the low 40s to the mid 60s in win-rate terms for sweep-reversal systems, with very different risk-reward profiles attached. Treat that spread as illustrative of the disagreement, not as data: almost none of those tests share a frozen rule set. That is precisely the problem.
Two backtests of "the liquidity sweep" are usually testing two different strategies. Four definition knobs dominate the outcome, and turning any one of them can flip a result from profitable to losing:
- Penetration depth. Does a one-tick poke through the level count as a sweep, or must price trade 0.2 ATR beyond it? Count everything and you flood the sample with noise; demand deep penetration and you exclude many of the cleanest rejections.
- Reclaim window. Must price close back inside on the same candle, within three candles, or any time that session? A same-candle rule tests wick rejections; a session-long rule tests something closer to failed breakouts. Different trades, same name.
- Session filter. All 24 hours versus London and New York Kill Zones only. Sweeps into concentrated session flow resolve differently from sweeps drifting through dead hours.
- Higher-timeframe context. Sweeps traded with the daily trend versus against it are near-opposite trades. Pooling them averages two different distributions into one meaningless number.
This is why no honest analyst will hand you a universal win rate for liquidity sweeps. The number is not a property of the pattern; it is a property of the pattern plus a specific rule set, market, session, and regime. Anyone quoting a precise figure without publishing their definitions is selling something.
The Base-Rate Problem: Most Wicks Are Not Sweeps
On a liquid pair, price violates some recent high or low constantly. Mark every 15-minute wick through every minor swing on EURUSD and you will tag dozens of "sweeps" per week. Most are continuation, chop, or interactions with levels nobody of size was watching. Unconditioned, the base rate of "wick through level, then reversal" sits near coin-flip territory — exactly what noise looks like.
Edge, where it exists, comes from conditioning. Restrict the event set to pools that are obvious on the higher timeframe — old daily and weekly extremes, equal highs a swing trader can see from across the room, session extremes during a kill zone — and the candidate count collapses from dozens per day to a handful per week.
That collapse is the point, not a side effect. Osler's cascades require clustered orders of size, and orders cluster at levels that are salient to many participants simultaneously. An anonymous 5-minute swing high carries no crowd, so sweeping it means nothing. The selection criteria are not decoration on a sweep strategy. They are the strategy.
What Separates Liquidity Sweeps That Work
Across practitioner playbooks and the more careful community tests, the same four filters keep separating tradeable sweeps from wick noise.
1. Higher-timeframe pool significance
The swept level must matter on the 1H, 4H, or daily chart: an old high or low, EQH/EQL, the previous week's extreme, or the terminus of a Draw on Liquidity. If you have to squint to find the pool, the market cannot see it either — skip it.
2. Kill-zone timing
Sweeps that fire into London or New York opening flow resolve fast, because the participation that fuels both the cascade and the reversal is concentrated there. The classic Judas Swing — the false early-session run that takes overnight liquidity — and the Turtle Soup fade of a multi-day extreme are both time-anchored for exactly this reason.
3. Displacement after the reclaim
Entering on the wick itself is a guess, because a genuine breakout looks identical at that moment. The confirming sequence is the reclaim — price closing back through the swept level — followed by displacement: an energetic, full-bodied move that shifts short-term structure via a Market Structure Shift (MSS) or Change of Character (CHoCH), ideally leaving a Fair Value Gap (FVG) to enter into on the retrace.
4. An opposing target
A sweep trade needs somewhere to go: an opposing liquidity pool within realistic reach, offering at least 2R from a stop just beyond the sweep extreme. No opposing draw, no trade — a perfect entry into dead air still loses.
Concretely: BTCUSDT builds equal highs at 110,000–110,060 over five days, clear buy-side liquidity on the 4H. During the New York open, price runs to 110,430; the next two 15-minute candles close back below 110,000 with displacement, leaving a 15-minute FVG at 109,700–109,850.
Entry in the gap, stop at 110,500, target the old low and sell-side pool at 107,900 — roughly 2.6R. That is the full anatomy: HTF pool, session timing, reclaim plus displacement, opposing draw.
One piece of arithmetic — and it is arithmetic, not a backtest. With a 2R average winner, breakeven is 33.3% wins before costs. At a 40% win rate you earn 0.4 × 2 − 0.6 × 1 = +0.20R per trade; at 45%, +0.35R; at 30%, −0.10R.
The four filters above exist to buy those few percentage points of win rate, and that handful of points is the entire distance between a durable edge and a slow bleed.
Where Sweep Trades Fail
The failure modes are as consistent as the success filters, and most of them are baked in before the entry is ever taken.
- Fading genuine breakouts. Not every run through a high is a sweep; some are expansion with institutional follow-through. The tell is acceptance: consecutive closes beyond the level, shallow pullbacks that hold, no reclaim. If price spends more than a few candles building beyond the swept level, you are not fading a stop run — you are shorting a breakout.
- Counter-HTF sweeps. Sweeping sell-side liquidity inside a strong daily downtrend frequently just continues lower. Sweeps that resolve back in the direction of the higher-timeframe trend and sweeps that fight it are different trades; pooling them is one of the fastest ways to turn a positive backtest negative.
- Illiquid pairs and dead hours. Thin books produce sweep-shaped noise. A wick through the high of a low-cap altcoin at 3 a.m. carries no clustered stops of size, no cascade, and no informed reversal flow. The mechanism that makes sweeps meaningful is simply absent, even though the candle looks textbook.
- Late execution. The read can be right and the trade still bad. Entering after displacement has already run halfway to the target turns a 2.5R idea into 0.8R with the same stop-out risk. Sweep edges are execution-fragile in a way trend edges are not.
How to Test Whether Liquidity Sweeps Work for You
You do not need to trust anyone's numbers — including the illustrative ranges in this article. A weekend and a spreadsheet settle the question for your market, your timeframe, and your rules.
- Freeze a mechanical definition. Pool type (say, 4H swing extremes and equal highs), penetration threshold, reclaim rule (close back inside within three entry-timeframe candles), entry trigger, stop placement beyond the sweep extreme, and target logic. Write it down before you look at a single outcome.
- Collect 100+ samples. At a true 45% win rate, 30-trade samples routinely print anywhere between roughly 30% and 60% observed. Small samples will tell you whatever you want to hear; the floor for a verdict is triple digits per rule-set variant.
- Split by regime. Tag every trade: trending versus ranging higher timeframe, high versus low volatility, session. An edge that only exists in New York trending conditions is still an edge — but only if you know that is where it lives.
- Log MFE and MAE. Maximum favorable and adverse excursion per trade reveal whether the pattern or your exits are the problem. If median MFE is 2.8R while you bank 1.5R, the setup works and your management does not — a fixable problem that raw win rate hides.
- Change one filter at a time. Rerun with a kill-zone filter, then with an HTF-bias filter, never both at once. Single-variable comparison is the only way to learn which filters actually pay for their reduced sample size.
The honest verdict, then. The phenomenon is real: stop clustering at salient levels is documented microstructure, sweeps of those levels are genuine two-sided liquidity events, and rule sets built on well-filtered sweeps can carry positive expectancy. The pattern by itself carries no edge — unconditioned, it approximates noise.
So, do liquidity sweeps work? Yes — for traders who treat each sweep as a hypothesis, let pool significance, kill-zone timing, displacement, and an opposing target do the selection, and then verify the whole rule set on their own data.
LiquidityScan's sweep scanners handle that filtering layer by flagging sweeps of higher-timeframe pools rather than every wick, but the verification discipline above is what turns the pattern into an edge.
Frequently Asked Questions
What is a realistic win rate for liquidity sweep strategies?
There is no universal number, and anyone quoting a precise one without publishing their rules is guessing or marketing. Community results span roughly the low 40s to mid 60s depending on definitions, sessions, and targets. With a 2R average winner, anything sustainably above 33% is profitable before costs — verify it on your own 100+ trade sample.
How do you confirm a liquidity sweep before entering?
Wait for the reclaim and displacement: price closes back through the swept level, then delivers an energetic move that shifts short-term structure (an MSS or CHoCH), ideally leaving a fair value gap to enter on the retrace. Entering on the wick itself, before any reclaim, is the lowest-probability version because a genuine breakout looks identical at that moment.
Do liquidity sweeps work on crypto as well as forex?
The mechanism transfers well. Crypto adds visible liquidation clusters around obvious highs and lows, which behave like stop pools, and leverage makes cascades violent. The market trades 24/7, but volume still concentrates around London and New York hours, so session filters remain useful. Thin altcoins are the exception — without clustered orders of size, sweeps there are mostly noise.
How many trades do you need to validate a sweep setup?
Treat 100 trades per rule-set variant as the floor. Below that, variance dominates: a genuinely 45% system can easily print 20-trade stretches that look like 65% or like 30%. If you also want regime splits — trend versus range, session versus session — you need proportionally more samples in each bucket before any comparison means something.
Related query paths
If this settled whether sweeps are worth your attention, the next questions are definitional and procedural: what exactly counts as a sweep, which pools matter, and how to run the test properly.
- What Is a Liquidity Sweep? — the clean definition and anatomy this article builds on.
- Liquidity Sweep Explained: The ICT Stop Hunt — deeper mechanics of the stop-run event itself.
- BSL vs SSL in SMC: Identify Liquidity — how to find the pools whose significance decides sweep quality.
- Inducement vs Liquidity Sweep: A Trader's Guide to SMC Setups — separating engineered bait from the tradeable event.
- London vs NY Liquidity Sweeps: Which Session Drives the Real Move? — the session-timing filter examined in depth.
- How to Backtest an ICT Strategy the Right Way — the full verification workflow behind the test outlined here.
- Liquidity Sweep vs Liquidity Grab: Is There a Difference? — how it connects to liquidity sweep vs liquidity grab.