
How Does the LiquidityScan Scanner Work?
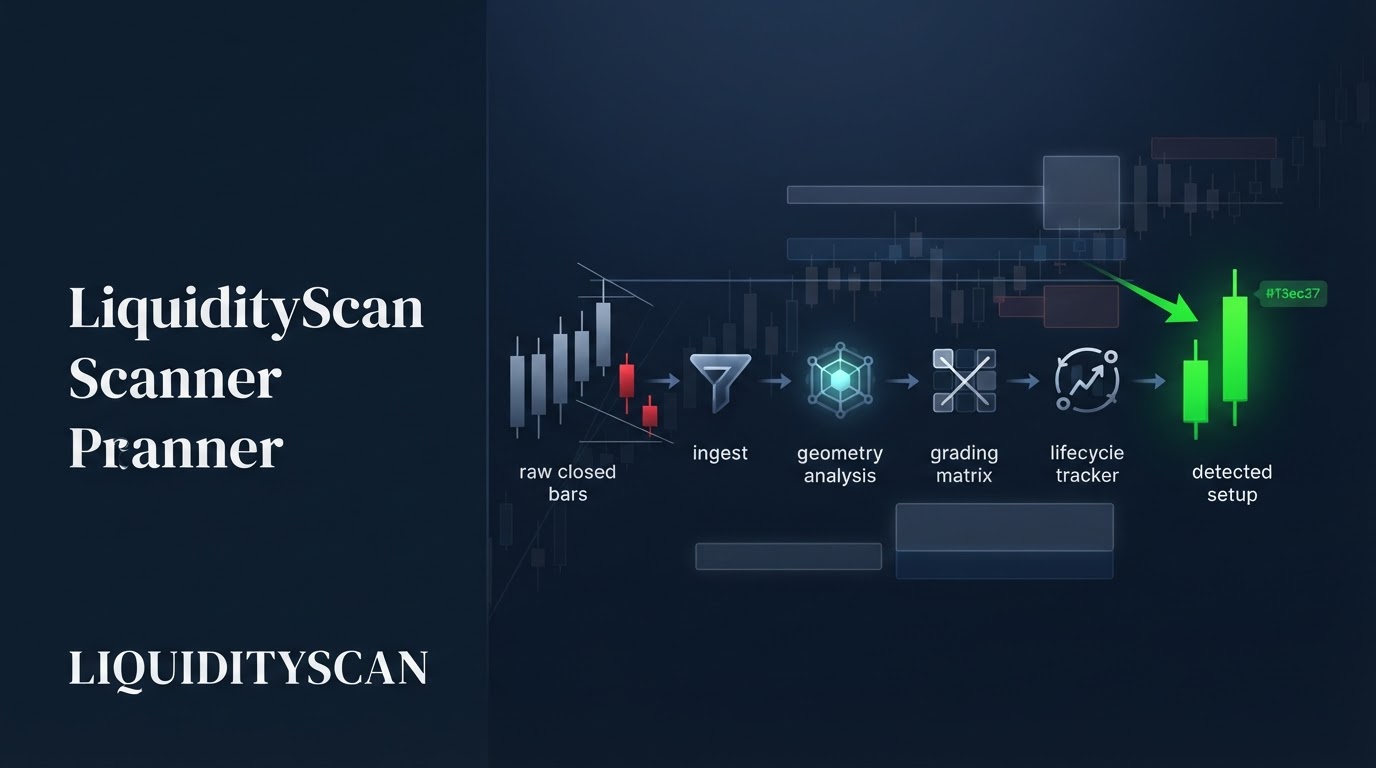
The LiquidityScan scanner works as a fixed pipeline: it ingests live candles across hundreds of symbols and timeframes, runs each engine's objective candle geometry to detect a setup, grades and cross-checks it, tracks its lifecycle, then delivers an alert you can verify on the chart.
There is no prediction model and no proprietary black box guessing direction. Every engine encodes a specific ICT concept as measurable rules over open, high, low, and close. The rest of this article walks the five stages end to end so you can judge each detection on its mechanics, not on trust.
- Stage 1 — Ingestion: confirmed candles are pulled per symbol and timeframe.
- Stage 2 — Detection: each engine tests its geometry on closed bars.
- Stage 3 — Validation & grading: freshness, displacement, and confluence filters.
- Stage 4 — Lifecycle: formed, then approaching, then touched, then outcome.
- Stage 5 — Delivery: feed cards with geometry plus push and in-app alerts.
Stage 1 and 2: From Raw Candles to Per-Engine Detection
Understanding how the LiquidityScan scanner works starts with the data layer. The scanner reads USDT-margined pairs from an in-memory WebSocket feed of live klines. If the socket is not ready, it falls back to a database-cached snapshot, and finally to a one-shot REST refill.
Field semantics are standard: openTime, open, high, low, close, volume, all in UTC epoch milliseconds with no DST drift.
The live bar is always dropped
Before any engine runs, the scanner slices off the in-progress candle and evaluates only confirmed, closed bars. This single rule is why detections do not repaint: a shape that appears mid-candle can vanish before the bar closes, so the scanner refuses to judge it until the candle is final.
The hourly cron scans 1h, 4h, 1d, and 1w on the top of each hour. A sub-hour dispatcher adds 15m and 5m for the engines where intrabar timing pays off, flushing on a short debounce after each lower-timeframe close so fresh structure is not held back until the next hour.
Every detection also records the signal candle's own open time, which anchors the geometry to a precise bar you can find again later.
Each engine is one ICT concept as geometry
Detection is not one algorithm but a family of independent engines, each encoding a documented concept as objective candle rules:
- Order Block (OB+ / OB++): a liquidity-native strong order block, where an impulse candle takes buy-side or sell-side liquidity (BSL or SSL). OB++ adds displacement of at least 1.5 ATR plus a Fair Value Gap (FVG).
- Fair Value Gap: a three-candle imbalance where the wicks fail to overlap, graded by multi-timeframe nesting into tiers (a small gap sitting inside a larger higher-timeframe gap scores higher).
- Market Structure (BOS / CHoCH): a Pine-faithful port that flags a Break of Structure or Change of Character from confirmed swing pivots.
- CISD / MSS: a change in state of delivery, found via pivot identification, a reverse candle, and a close through the resulting MSS level.
- CRT, Super Engulfing, RSI Divergence: candle-range sweeps, engulfing continuation and reversal bodies, and Wilder-RSI pivot divergences.
Because each rule is arithmetic on closed candles, the output is deterministic. Feed the same bars twice and you get the same detection twice. The table below maps each engine to the concept it encodes and the measurement that raises its grade.
| Engine | ICT concept | Detection geometry | What raises the grade |
|---|---|---|---|
| OB+ / OB++ | Order block | Impulse candle that sweeps BSL or SSL | Displacement ≥ 1.5 ATR plus a fair value gap |
| FVG | Fair value gap | Three-candle wick imbalance | Nesting inside a larger higher-timeframe gap |
| Market Structure | BOS / CHoCH | Close beyond a confirmed swing pivot | Alignment with the higher-timeframe trend |
| CISD | Change in state of delivery | Pivot, reverse candle, close through MSS level | Breakout inside the NY 09:00–14:00 window |
| CRT | Candle range theory | Wick sweep with body back inside prior range | Smaller signal-candle body than the swept bar |
Stage 3: Validation, Grading, and Confluence
A raw geometric match is a candidate, not a signal. The next stage filters and scores it so that only context-rich detections surface.
Freshness and first-touch
Zones decay. An FVG that price has already traded back through is not the same as a fresh, untested gap, so the FVG engine requires first-touch freshness before it treats a nested gap as live. The same logic runs across engines: a setup earns its status from being unmitigated, not merely from having formed at some point in history.
Displacement and objective thresholds
Strength tiers come from numbers, not opinion. An order block is promoted to OB++ only when the impulse leg displaces by at least 1.5 ATR and leaves a fair value gap behind. CISD is tagged High-Prob MSS only when the breakout candle closes inside the New York 09:00–14:00 window. These thresholds are fixed constants you can reproduce on your own chart.
Confluence: multiple engines agreeing
The highest-context layer folds live detections into multi-timeframe alignment chains. When a weekly, daily, and 4h read point the same direction, or when two different engines flag the same pair and side, that agreement is what the confluence layer surfaces.
A temporal-coherence check prevents phantom stacks, so a three-week-old weekly cannot pair with a fresh daily and pretend to be aligned. Confluence does not make a setup correct; it raises the amount of context behind it.
Stage 4 and 5: Lifecycle Tracking and Delivery
Detection is a moment; a trade is a process. The scanner tracks each setup through its life rather than firing once and forgetting it.
Formed, approaching, touched
Once a zone is detected it sits in a formed state. A proximity loop then watches price relative to the zone and can raise a pre-arrival alert as price approaches, before the level is even touched, which is the practical value of a scanner that never sleeps.
When price reaches the zone the state advances to touched, and the outcome engines take over. Engines with defined targets track TP1, TP2, and TP3, and move the stop to breakeven once the first target prints, so a runner cannot turn into a loser.
Others grade the result qualitatively as strong, weak, or failed based on how the next confirmed candles close relative to the level, or simply expire the setup after a fixed candle budget when nothing decisive happens. Each transition is timestamped, so the card carries an honest audit trail rather than a single frozen snapshot.
Delivery you can inspect
Surviving detections reach you two ways. First, feed cards render the actual geometry, the order block, the gap, the swing, the MSS level, so you can judge the signal without opening a full chart. Second, alerts fire through push notifications and in-app delivery.
A hard volume floor drops any pair under roughly twenty million dollars of 24-hour quote volume, so illiquid symbols never reach your table in the first place.
Objective by Construction: Why the Scanner Doesn't Repaint
The reason how the LiquidityScan scanner works matters is that the whole pipeline is deterministic. Same candles in, same detection out. Three properties follow directly:
- No repaint: only closed bars are evaluated, so a detection cannot appear and then quietly disappear.
- Backtestable: because every rule is arithmetic, you can replay historical candles and reproduce exactly what the scanner would have flagged.
- Verifiable: every card exposes its geometry, so you can pull up the same pair and confirm the sweep, gap, or break with your own eyes.
Transparency is the point. A tool that shows its work invites you to disagree with it, and a setup you can verify is one you can size and manage with conviction.
It also changes how you improve: because the rules are fixed, a losing detection is a data point about market regime or your own filters, not evidence that the scanner quietly moved the goalposts.
You can export the conditions, replay them, and decide whether to tighten which grades you act on. That feedback loop is only possible when detection is objective by construction rather than a shifting judgment call.
What the scanner does not do
Being honest about limits is part of being trustworthy. The scanner does not predict where price will go, does not guarantee an outcome, and does not replace your judgment. Detection is not the same as a profitable trade.
A perfectly valid order block can still fail because the higher-timeframe draw on liquidity sits the other way, or because news repriced the pair. The scanner surfaces context-rich candidates; you supply the bias, the confluence you require, the entry, and the risk. Treat any grade as a description of structure, never a promise of profit.
The Life of a Detection: A Worked Walkthrough
Here is a realistic, illustrative sequence, the shape a detection takes rather than a claim about any specific trade.
- Candles close. On 4h BTCUSDT, an impulse candle drives up, sweeps a cluster of sell-side liquidity beneath a prior low, and closes with strong displacement. The bar finalizes; the scanner picks it up on the next evaluation.
- The engine fires. The order-block engine confirms the impulse took SSL and left a fair value gap in its wake. The displacement clears 1.5 ATR, so the candidate is graded OB++ rather than a plain OB+.
- Grading and confluence. The zone is unmitigated (first-touch fresh). The confluence layer notes the daily bias reads the same direction, adding context to the card.
- Proximity alert. Hours later price retraces toward the block. The proximity loop fires a pre-arrival push before the level is tapped, giving you time to prepare rather than chase.
- You decide. You open the chart, confirm the geometry, check that your own higher-timeframe read and session timing agree, and only then choose to act or pass. The scanner brought you a graded, tracked, verifiable candidate; the trade decision stays yours.
If price closes back through the zone against you, the lifecycle marks it failed and the card reflects that outcome honestly, which is exactly the record you need to review later.
That end-to-end path is how the LiquidityScan scanner works in practice: it converts raw candles into a graded, tracked, verifiable candidate and hands you the decision. Nothing in the pipeline predicts the future or promises a win.
It removes the manual work of watching hundreds of charts for objective structure, so your attention goes to bias, context, and execution, the parts a scanner cannot and should not automate for you.
Frequently Asked Questions
Does the LiquidityScan scanner repaint its signals?
No. Every engine slices off the in-progress candle and evaluates only confirmed, closed bars. A shape that forms and vanishes mid-candle is never persisted, so a detection you saw yesterday will still be there today with the same geometry. That is what makes the output reproducible and backtestable.
Can I trust a detection without checking the chart?
You can act faster, but you should still verify. Each feed card renders the actual order block, gap, or market-structure break so you can judge it at a glance, and the full chart lets you confirm the sweep and context. The scanner finds context-rich candidates; final judgment and risk are yours.
What does a grade like OB++ or High-Prob MSS actually mean?
It means the candidate cleared extra objective thresholds. OB++ requires displacement of at least 1.5 ATR plus a fair value gap on the impulse leg. High-Prob MSS requires the breakout candle to close inside the New York 09:00–14:00 window. Grades describe structure and timing, not a guaranteed result.
Why did an illiquid pair never show up in my feed?
A hard volume floor removes any pair under roughly twenty million dollars of 24-hour quote volume before it reaches your table. Thin markets produce unreliable geometry and poor fills, so the scanner filters them out rather than surface noise you cannot realistically trade.
Related query paths
Follow the concepts behind each engine, from what the platform is to how to verify it on your own data.
- What is LiquidityScan? — the platform overview behind the scanner pipeline.
- What Is an Order Block? — the concept the OB+ engine encodes as geometry.
- What Is a Fair Value Gap (FVG)? — the three-candle imbalance the FVG engine grades.
- What Is Market Structure in ICT? — the swing logic behind BOS and CHoCH detection.
- What Is CISD in ICT Trading? — the change-in-state-of-delivery engine explained.
- How to Backtest an ICT Strategy the Right Way — verify deterministic detections on your own history.
- LiquidityScan Pricing & Plans Explained: Free, Starter, and Pro — how it connects to liquidityscan vs tradingview indicators.
- Is LiquidityScan Legit and Reliable? How the Detection Is Validated — a closely related next step.