
Is LiquidityScan Reliable? What Reliability Actually Means
Yes, if you define reliable correctly. For a scanner, reliable does not mean it predicts winners. It means it detects exactly what it claims, consistently, without repainting, and in a way you can verify against the raw chart yourself. That is detection fidelity, and it is checkable.
The question most cautious buyers really mean is: will this tool tell me the truth about what is on the chart? That is a fair question, and it has an honest answer that does not require you to trust a marketing number.
Below is what reliability should mean, how LiquidityScan earns it by construction, and how a skeptic can confirm all of it before paying anything.
What "Reliable" Should Mean for a Detection Tool
People asking whether a trading scanner is reliable are usually asking the wrong question. The instinct is to ask "how often is it right?" as if the tool forecasts price. A pattern scanner does not forecast. It identifies structure that is already printed on the chart. So reliability splits into two very different claims:
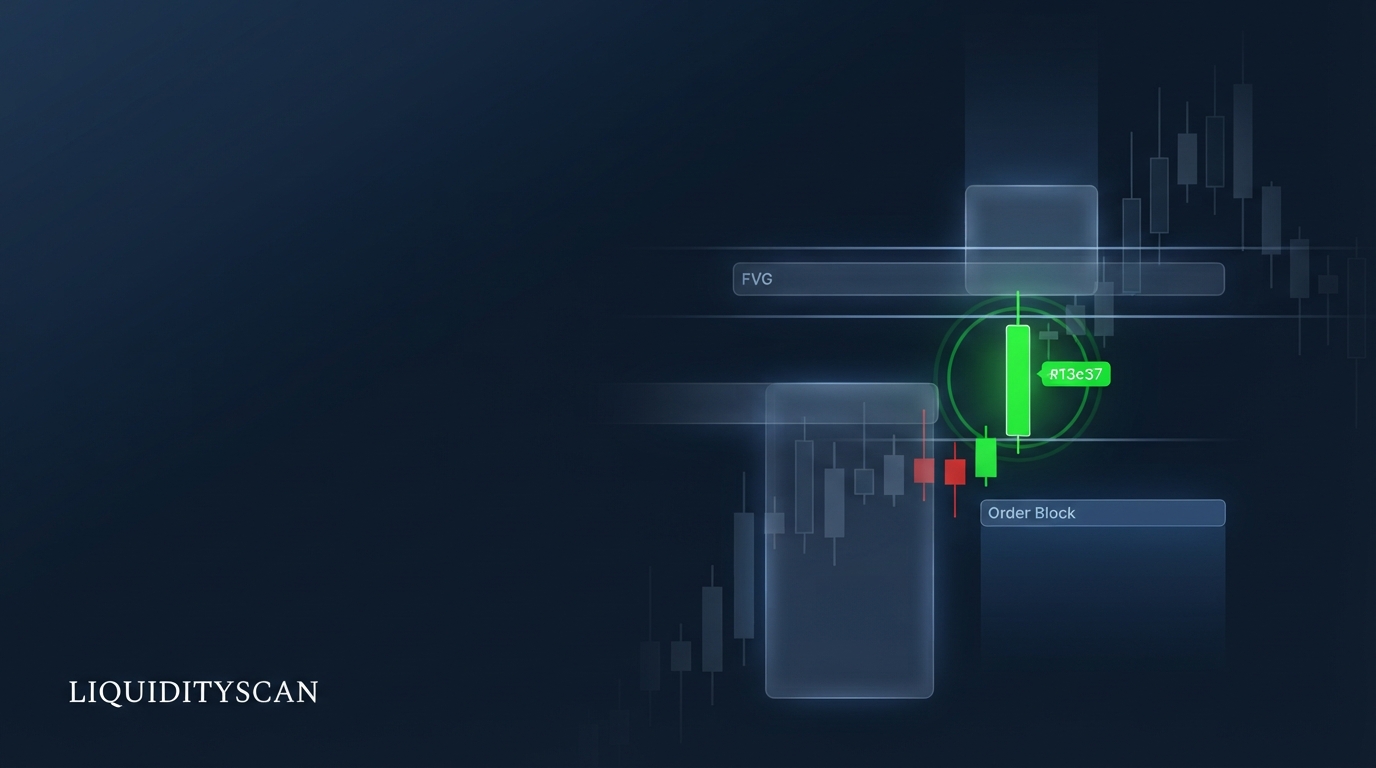
- Detection fidelity — when the tool flags an Order Block, a Fair Value Gap (FVG), a break of structure, or a liquidity sweep, is that thing actually there by a stated, checkable rule? This is what reliable should mean.
- Trade profitability — does acting on the detection make money? This depends on market context, your entry, your stop, your management, and the regime. No honest scanner controls those variables.
A reliable scanner nails the first claim and makes no promise about the second. If a vendor blurs the two — selling detection but implying profit — that is the warning sign, not the reassurance.
So when you ask is LiquidityScan reliable, hold it to the fidelity standard: correct, consistent, reproducible detection. That is the bar it is engineered to clear, and the only bar a scanner can honestly guarantee.
How LiquidityScan's Detection Is Validated by Construction
The core trust argument is simple: every detection is a deterministic function of candles you can see. There is no proprietary sentiment feed, no hidden "AI conviction score" you cannot inspect. Each scanner reduces to objective candle geometry, and the same candles always produce the same result.
A few concrete examples of the rules in plain terms:
- Super-Engulfing inspects the last two closed candles. A bullish continuation requires the current candle to be bullish, the prior candle bullish, the current low below the prior low, and the current close above the prior close. Those are four inequalities you can check by eye.
- CRT (Candle Range Theory) requires the signal candle's wick to sweep beyond the prior candle's high or low while its body closes back inside the prior range, with a smaller body than the candle it swept. Again, pure geometry.
- 3OB (three-bar Order Block) needs a specific bull-bear-bull (or bear-bull-bear) sequence where the third candle closes past the middle candle's high or low.
- CISD / market-structure detection walks confirmed pivots, finds the reverse candle, and requires a body close through the defined level before it marks a shift.
Because each rule is a set of comparisons on open, high, low, and close, a detection is reproducible from the same candles. Hand anyone the same bars and the same rule, and they reach the same verdict.
That reproducibility is what "validated by construction" means. You are not asked to trust a black box; you are asked to check arithmetic. This is the heart of why the tool can be called reliable in the fidelity sense.
Two design choices reinforce this. First, detections run only on liquid instruments — pairs below a meaningful 24-hour volume floor are dropped, because structure on a thin, easily-manipulated symbol is not trustworthy context regardless of how clean the geometry looks.
Second, each candidate is enriched with objective metadata: the swept level, the range extremes, the pattern family, and a freshness state derived purely from how many candles have printed since the signal. None of that metadata is a subjective opinion about direction; it is bookkeeping about the candles themselves, which is exactly why you can audit it.
No Repaint: Detections Are Anchored to Closed Candles
The most common way indicators lie is repainting — a signal that appears in hindsight, or moves after the fact, so a backtest looks perfect but live trading never matches. LiquidityScan is built to make that impossible by two mechanical rules.
The live bar is always dropped
Every scanner begins by discarding the in-progress candle and evaluating only confirmed, closed bars. A pattern that seems to be forming on the current candle is never emitted; it only fires once that candle closes and its values are final. A closed candle cannot change, so a detection built on closed candles cannot silently rewrite itself.
The timestamp is fixed to the candle, not to "now"
When a signal fires, its detection time is anchored to the signal candle's own open time — a fixed point on the chart, not the moment you happened to load the page. Downstream freshness logic works from the candle's close time. The consequence: a signal you see at 14:00 carries the same anchor it had at 10:00; it did not migrate to a better-looking bar.
That fixed anchoring is what lets you scroll back, find the exact candle, and confirm the setup was valid at the time it was called. A repainting tool cannot survive that test. A no-repaint tool invites it.
What LiquidityScan Is (and Is Not)
Being honest about scope is part of being reliable. LiquidityScan surfaces valid, context-tagged candidates. It does not tell you to buy or sell, and it does not promise those candidates win. Here is the boundary, stated plainly.
| LiquidityScan is | LiquidityScan is not |
|---|---|
| A detection engine that flags objective ICT/SMC structures on closed candles | A signal service issuing buy/sell calls |
| A verifiable, no-repaint record of what printed and when | Financial advice or a recommendation to enter any trade |
| A context layer (freshness, timeframe alignment, direction) around each candidate | A win-rate guarantee or a promise of profit |
| A tool whose rules you can describe and reproduce | A black-box "AI" that hides how it decided |
Notice that some scanners deliberately carry no profit outcome at all. The market-structure and CISD markers, for instance, track invalidation and expiry — they are context, not scored trade calls. That restraint is intentional: the tool reports what is on the chart and stops there. Reliability lives in that discipline, not in an inflated claim.
How a Skeptic Should Evaluate It
You do not have to take any of this on faith. The right way to judge is to try to break it. Here is the exact test a cautious buyer should run.
1. Pick any live detection and open the chart
Take a fresh order-block, sweep, or structure signal from the feed. Open the same symbol and timeframe on your own charting platform. Do not look at the tool's drawing yet — form your own read first.
2. Confirm the geometry by the stated rule
Walk the rule for that pattern. Is the sweep really beyond the prior extreme? Did the body actually close back inside the range? Is the three-bar sequence exactly as specified? If the structure is there by the rule, that detection is faithful. If you can find detections that fail their own rule, that is a real reliability problem — go looking for it.
3. Check the anchor and the freshness
Note the candle the signal is pinned to. Scroll back to it. It should be a specific, unchanging bar, and the setup should have been valid at that bar's close — not only in hindsight. Watch how the freshness state ages as new candles print; a detection that just fired should read as fresh and decay predictably.
4. Test the alerts and the outcome tracking
Let a signal run and watch how the lifecycle resolves — target hit, stop hit, or time-expiry. The outcome is recorded honestly, including losses. A tool that hides its losing outcomes is not being reliable; one that shows them is.
Run this on a dozen signals across timeframes. If the geometry holds and nothing repaints, you have verified detection fidelity with your own eyes — which is worth far more than any performance number a vendor could print.
And because the rules are the same for every symbol and every timeframe, a spot-check on ten signals is genuinely representative: there is no special case where the tool quietly switches to a different, hidden logic.
Consistency of rule application is itself part of reliability, and it is the easiest property to confirm — pick setups that look marginal on purpose and see whether the tool's verdict tracks the actual geometry rather than flattering it.
The Honest Limits: A Valid Detection Can Still Lose
Here is the part most marketing pages omit. A correctly detected Order Block can still fail as a trade. A textbook Fair Value Gap can be blown straight through. Detection fidelity guarantees the structure was really there; it guarantees nothing about what price does next.
Why? Because outcomes are decided by variables outside the scanner's job:
- Market context — the same OB behaves differently in a trend, a range, or ahead of high-impact news.
- Higher-timeframe draw — a valid setup against the dominant Draw on Liquidity is a lower-quality trade even when the pattern is flawless.
- Your execution — entry timing, stop placement, sizing, and management turn the same candidate into a win for one trader and a loss for another.
The scanner's responsibility ends at surfacing a valid, context-tagged candidate. Judgment and risk management are yours. Anyone selling you a scanner as a money printer is overpromising, and overpromising is the opposite of reliable. LiquidityScan is transparent about this boundary on purpose — the rules are describable, the outcomes are recorded warts-and-all, and there is no black box asking for blind trust.
That transparency is the real trust model, and it is also why the answer to "is LiquidityScan reliable" can be a confident yes on the only claim a scanner can honestly make: it detects what it says, consistently, without repaint — and it lets you prove that for free before you ever pay, so the reliability is yours to confirm, not ours to assert.
Frequently Asked Questions
Does LiquidityScan repaint its signals?
No. Every scanner evaluates only closed candles — the live in-progress bar is dropped before detection runs — and each signal is anchored to a fixed candle timestamp. Because a closed candle cannot change and the anchor does not migrate, a fired signal cannot retroactively rewrite itself the way repainting indicators do.
Are these buy and sell signals?
No. They are context, not commands. LiquidityScan flags objective structures — order blocks, fair value gaps, sweeps, structure shifts — that are already on the chart, tagged with freshness and direction. Whether to trade, and how, is your decision. Treat each detection as a candidate for your own analysis, not an instruction.
Does it guarantee profit or a win rate?
No, and any tool that does is misleading you. Detection fidelity is guaranteed — the pattern is really there by a checkable rule. Trade outcomes are not, because market context, higher-timeframe bias, and your execution decide them. Reliability here means accurate detection, not predicted profit.
How can I verify it is reliable before paying?
Take any live detection, open the same chart yourself, and confirm the geometry matches the stated rule. Check that the signal is pinned to a specific past candle and did not appear in hindsight. Watch a few resolve, including losers. The free tier lets you run this test yourself first.
Related query paths
Keep evaluating from the ground up — understand what the tool detects, the exact rules it applies, and how to stress-test any pattern-based edge on your own data.
- What is LiquidityScan? — the full picture of what the platform detects and why.
- What Is an Order Block? — the structure behind many detections, defined precisely.
- The Core Order Block Validation Rule for SMC Traders — the exact rule to check a flagged OB against.
- Valid vs Invalid BOS ICT: A 3-Factor Confirmation Guide — how to confirm a structure break is real.
- Do Order Blocks Still Work? A Data-Driven Framework for 2026 — honest evidence on whether the setups hold up.
- How to Backtest an ICT Strategy the Right Way — verify any edge on your own data before trusting it.
- LiquidityScan Pricing & Plans Explained: Free, Starter, and Pro — how it connects to liquidityscan vs tradingview indicators.